Using Google’s HEART Framework to Improve User Experience: A Data-Driven Approach to User-centered Design and Innovation
Google’s HEART Framework is a popular approach in UX design that helps designers and researchers to measure the user experience of a product or service.

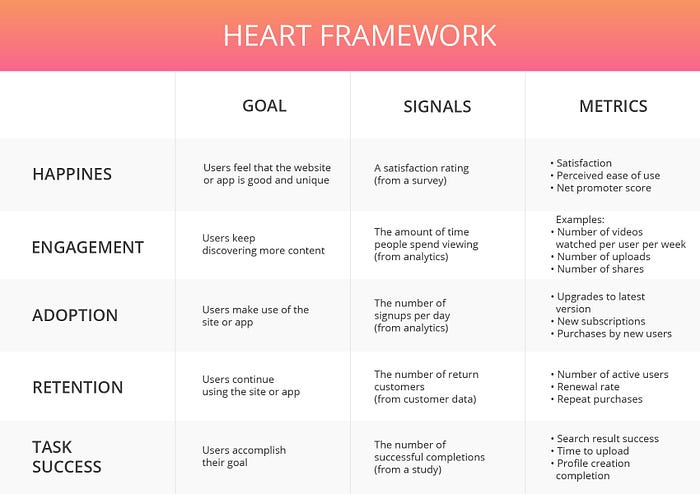
The framework focuses on five key metrics that are essential to evaluating the quality of user experience:
Happiness: This metric measures how satisfied or happy users are with the overall experience of using the product or service.
Engagement: This metric measures the level of user engagement and interaction with the product or service.
Adoption: This metric measures the user adoption rate or how quickly users start using the product or service.
Retention: This metric measures how well the product or service retains its users over time.
Task Success: This metric measures how successful users are in completing the tasks they set out to achieve when using the product or service.
When should you use the Google HEART Framework?
The Google HEART framework is useful in situations where you want to evaluate and improve the UX of a digital product or service. For example, you might use the framework to:
- Evaluate the UX of an existing product or service and identify areas for improvement.
- Measure the impact of UX changes or redesigns.
- Compare the UX of different products or services to identify strengths and weaknesses.
- Set UX goals and track progress towards those goals over time.
How to Use the Google HEART Framework to Improve UX in Product or Service Design.
Determine which aspects of the user experience you want to measure: Start by identifying the key factors that contribute to a positive user experience for your product or service. This could include aspects such as happiness, engagement, adoption, retention, or task success.
For example, you might measure user satisfaction or Net Promoter Score for Happiness. For Engagement, you might measure time spent on the product or the number of visits.
Define specific metrics for each aspect: Once you have identified the key factors, define specific metrics that you can use to measure them.
For example, to measure happiness, you could use surveys, feedback forms, or reviews to collect feedback from users about their satisfaction with the product or service.
Collect and analyze data: Collect data on the metrics you have defined, and use this data to analyze the user experience. This could include tracking usage patterns, conducting user surveys or interviews, or analyzing user behavior through analytics tools.
Use insights to improve the user experience: Once you have analyzed the data, use the insights gained to make improvements to the product or service.
For example, if you find that users are not engaging with a certain feature, you could redesign the feature or provide additional guidance to encourage user engagement.
Monitor and iterate: Finally, continue to monitor the user experience using the HEART Framework and iterate on your design based on the feedback and data collected. This will help you continuously improve the user experience and create a product or service that meets the needs of your users.
Product Examples and Best Practices
H — Happiness Metrics
Let’s start with happiness metrics, which measure how satisfied a consumer is with a product or how much they value it.
In the B2B and B2C context
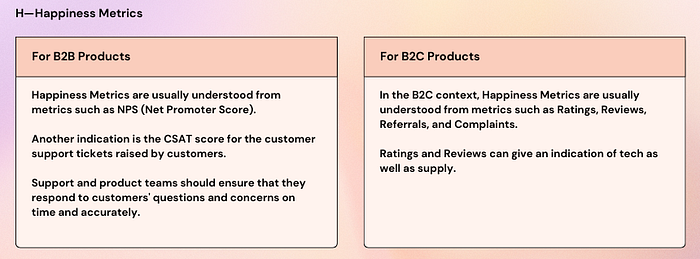
Let’s say you’re designing a mobile app for a food delivery service. To measure happiness, you could ask users to rate their overall satisfaction with the app after using it for a certain period.
You could ask them to provide feedback on what they liked and didn’t like about the app, which could help you identify areas for improvement.
You could also ask users to refer to the app in their network. The referral metric gives a very clear indication that users are proud of the product, find value in the product, and are willing to recommend it to other users.
E — Engagement Metrics
How frequently do users return to use and engage with our product? is a question that is answered by the HEART framework’s Engagement Measure.
In the B2B and B2C context
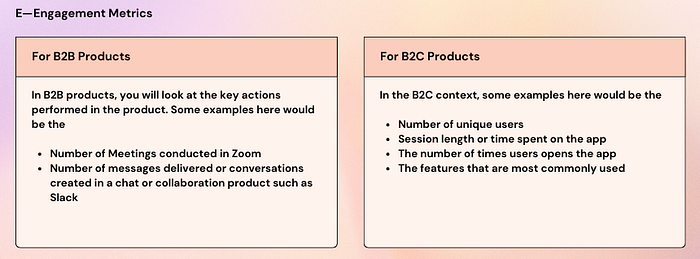
Let’s say you’re designing a fitness app to measure engagement, you could track the number of times users complete workouts or log their meals using the app. You could also look at the social features of the app and see if users are engaging with other users by sharing their progress or commenting on each other’s posts.
Some other examples are-
A Location tracking app tracks how often users search for directions or use the app to navigate.
A Hotel booking app tracks the number of bookings and messages exchanged between guests and hosts.
A Project collaboration app tracks the number of messages sent and channels used by users.
A Music app tracks the number of songs streamed and playlists created by users.
A File Sharing app tracks the number of files uploaded and shared by users.
A — Adoption Metrics
This helps us learn “How many people are not only engaging but also becoming regular or active users.”
In the B2B and B2C context
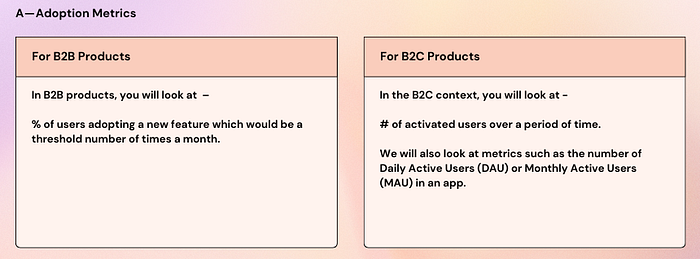
In the context of a fitness app to measure adoption, you could track the number of users who sign up and complete their first workout or log their first meal within a certain period. You could also look at the onboarding process of the app and see if users can complete it smoothly.
Some other examples are-
A Maps app tracks the number of users who download the app and start using it within a certain period.
A Hotel booking app tracks the number of users who sign up and complete their first booking within a certain period.
An eCommerce app tracks the number of new customers who sign up and complete their first purchase within a certain period.
R — Retention Metrics
Retention metrics are used to monitor customers who use your product repeatedly over time.
In the B2B and B2C context
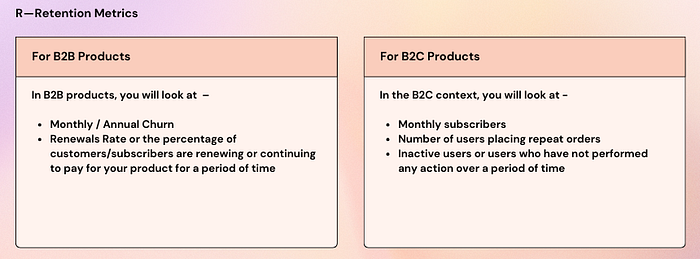
Let’s take the same example for a fitness app, to measure retention, you could track the number of users who continue to use the app over time, as well as the frequency and duration of their usage. You could also look at the reasons why users stop using the app and see if there are any common issues or pain points that need to be addressed.
Some other examples are-
To measure retention, a social media app tracks the frequency and duration of users’ usage over time.
An eCommerce app tracks the frequency and duration of customers’ purchases over time.
T — Task Success Metrics
Finally, the last metric Task Success Metrics, helps us figure out whether consumers can complete the primary task for which they use our product quickly and easily.
In the B2B and B2C context
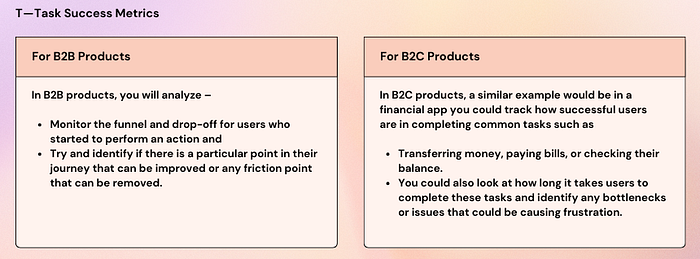
Let’s say you’re designing a website for an e-commerce store. To measure task success, you could track how successful users are in completing common tasks such as finding a product, adding it to their cart, and checking out. You could also look at how long it takes users to complete these tasks and identify any bottlenecks or issues that could be causing frustration.
You need to look at the drop-off points on the page to understand where there is friction to ensure the journey from start to end is completed.
Google HEART Framework Example
The process of Goals-Signals-Metrics should enable you to come up with a prioritization of the metrics so that you can use the ones that are most effective and important first and then use the lesser important ones later. Only use those metrics that are related to your personalized goals and avoid wasting time on the ones that require extra implementation efforts.
Download the Google Heart Framework PDF worksheet to get started with user-driven UX metrics.
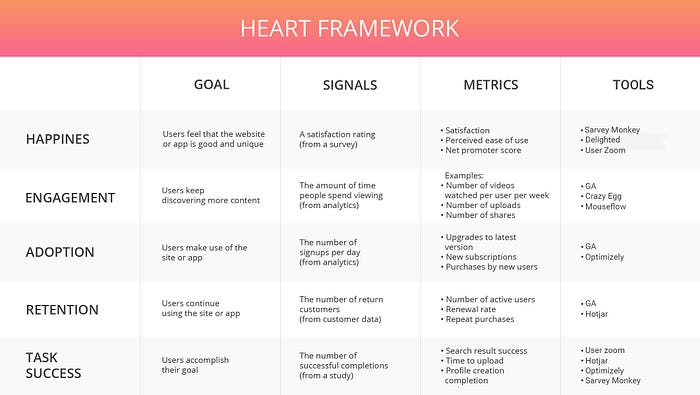
What are the Tools to Measure Metrics
Now we have learned about Google’s HEART framework and its Goals-Signals-Metrics let’s see what are the tool through which these metrics can be achieved.
Several tools can be used to measure the H-E-A-R-T, depending on the specific goals and objectives of the project. Here are a few commonly used ones:
Analytics: Analytics tools can provide valuable insights into user behavior, such as how users are interacting with the design, how long they are staying on the site or app, and where they are coming from. This data can be used to optimize the design for maximum efficiency.
A/B Testing: A/B testing involves comparing two different versions of a design to see which one performs better in terms of user engagement and conversions. This can be an effective way to optimize the design for maximum efficiency.
Heat Mapping: Heat mapping is a technique that involves tracking user interactions with a website or app to identify areas of high user engagement and areas where users are dropping off. This can help designers optimize the design for maximum engagement and efficiency.
Usability Testing: This is a technique that involves observing users as they interact with a website, app, or other digital product. It can help identify usability issues and areas for improvement in the UX design
Surveys and Feedback: Surveys and feedback tools can be used to gather feedback from users about their experience with the design. This can help designers identify areas for improvement and make changes that will improve the overall efficiency of the UX design.
It’s important to note that no single tool is perfect, and a combination of tools may be necessary to get a comprehensive picture of the user experience.
Wrapping up!
These examples demonstrate how the HEART Framework can be applied to various features and aspects of a product or service to improve the user experience and drive business outcomes. By using this framework, companies can gain valuable insights into user behavior and preferences, and make data-driven decisions that lead to positive impacts on user engagement, retention, and satisfaction.

