The ultimate AI research methodology each product designer should know
Learn how tools like Arc, Perplexity and FigJam streamline your research process, enable data reliability and save precious time.

For product designers a properly conducted research is the base of everything we later on execute in our design work. But a thorough research always comes with the cost of time: we look for data, we verify it, “we try it on”, analyze it, make conclusions about it, write it down and (if we have some time left), we properly organize it in a nicely wrapped presentations; one that will keep on moving from one eye to another, sometimes even much later on in the our work process.
Those stages of research teach us what we are about to deal with, what trends are out there and what users are used to, and they don’t have to take so much time anymore! There are many AI tool out there that can revolutionize the time, quality and methodology of research for us product designer. In this article I will introduce you to a research workflow, which will includes 3 main AI tools I believe each product designer should know.
So let’s get down to it.
1st tool: The Arc Browser
As designers most of our work evolves around what users see (or don’t see) in our products, and how what they see influence their actions and experience. When we are researching competitors’ products we are playing the role of a user of these products. We are looking at those products, acting in them and comparing them to our (or other similar) products. Our experience is visual, our research is visual, we collect it, take screenshot, summaries and design it for presenting to our colleagues. But there is always too much of it and we are always overwhelmed. This is where arc comes in!
Download and install Arc Browser on your computer. If you’re already using arc and are familiar with its unique UI and features you can move on to the 2nd tool, If you’re new to arc, stay with me.
Arc has many useful features, but I’m goanna focus on four of them, which are the most useful ones for research and comparison purposes:
1. Notes:
This feature enables you to output all your brain mess, links you find on the way, action items that comes to mind and screen shots you collect. We would usually gather all of those on different app (google docs, figma, browser bookmarks etc.), a move that will force us to move between too many windows we have open, and will distract our attention and effectivity. By gathering all of it in the actual platform we work on, we get visual and cognitive clarity that will save us time and prevent distractions. To create a note click on the “+” icon at the bottom of your sidebar and select the “New Note” option. The not will open in a new tab which you can add to split view with the tab you are working on.

2. Split view:
The Arc split view enable us to work simultaneously with up to 3 tab, one next to the other at the same time. Just hit the right click on the tab you wish to add to split view and select the “Add to split view” option (you can then “hide sidebar” by clicking “Command + S” for better view of your tabs). Here are same example to what we can use it for:
- Comparing mobile apps (using the inspect mode).
- Keep the arc notes open for typing, next to a tab you're researching.
- Compare the answers of your different bots for similar prompts.
- Comfortably open links from current page (use the mouse right click).

3. Quick view:
By clicking the shift key and hovering over a link ,arc will supply you with a brief summary bubble of what this link holds. If you will click the link while holding the shift key, a light-box of the link itself will open, enabling you a quick view of it. All this happens without actually opening another tab and cluttering ourselves with more visual mess. These options will become very handy when going over perplexity sources (see in the next section).

4. Ask Chat GPT:
By clicking “Command + T” a popup will appear with a textbox in which you can directly ask Chat GPT a question (you have to start typing your question for the GPT option to appear). Another option in this popup is to move quickly and easily between your tabs, or open a new one (just type what you need and click “Enter”).

Other useful Arc features are:
- Spaces: For creating research focused, distraction free zone.
- Pinned tabs: For keeping your commonly used tabs reachable.
- Folders: Helps you organize your research.
- Today’s tabs: Automatically delete uncategorized tabs after a time limit defined by you, in order to declutter your work space.

When using arc I highly recommend investing some effort in memorizing some of it’s keyboard shortcuts, as it will make your experience in researching on it, so much more comfortable and effective. The main keyboard shortcut I use are:
- Command + S: Show\hide the sidebar (especially useful in split view).
- Shift + Hover: A brief summary of a link.
- Shift + Mouse Click on a link: Open quick view.
- Command + T: Ask Chat GPT, move between tabs and open a new tab.
- Control + Tab: Move between 5 recent tabs.
- Control + Shift + Plus Sign (+): Add Split View.
For more on how to use arc:
I Switched to Arc Browser, and Will Never Turn Back! \ Akshay Hallur
2nd tool: Perplexity
We already have Chat GPT and Claude, our helpful bots for creative writing, virtual assistants, artistic exploration and creative brainstorming. So why do we need another AI bot?
Well you’re right. In a way… The thing is, when it comes to research, I was trying to make friends with Chat GPT and Claude, but something kept bothering me about them. No matter how long and open our conversations were, how philosophical we got, I felt I couldn’t really trust those guys. They were very good at giving me neatly phrased answers, well organized in any format I request, but I could never know where they got their facts from. I watched them fill my screen with words and punctuations that, for all I knew, could have been the result of a complete hallucination. As in my work process I have to be able to make well informed, data based decisions, I kept on double checking their responses, some of which I managed to verify, but many of I had to ignore from lack of reliability. So the time they saved me and quality of data they gave me became irrelevant…
With this in mind, I kept searching for more thorough and reliable AI bot, one that I could trust with just a glance. I was longing for a deep long term relationship, which I finally got when perplexity came into my Arc!

While chat GPT, Claude and Perplexity AI are all AI chatbot tools designed to interact with users, understand context and respond in natural language, they are tailored for different use cases. Chat GPT and Claude’s strength lies in their natural, human-like responses, making conversation intuitive. However, they are updated up to a certain point in the past, not connected to web, their answers lack citations, source indication and could many times contain hallucination.
On the other hand, Perplexity AI is acting (much like the arc browser), as the arrival of the old-fashioned web search engine to the modern days of 2024, bearing in mind users frustrations, overwhelmed-ness and many other pain points that were never answered since 1998.
Perplexity provides us with well phrased detailed responses, which includes citations and source indications, allowing us to quickly and easily verify it sources. It is basing its responses on the enormous amount of up-to-date and relevant data it finds online in real time, prioritizes concise, verifiable answers with links to sources. Concurrently it integrates the ability of phrasing complete answers to what I ask him, alongside indicating exactly what it’s answer are based on. We can also very quickly and easily have a look to reassure ourselves, by clicking the shift key and hovering over links in his response, to get the arc summary. Or by clicking the shift key and the link itself, for a quick view or deeper drilldown. This is done without actually opening another tab and cluttering ourselves with more visual mess and distractions.
By utilizing perplexity advanced search capabilities, designers could receive in one go verified data for both verbal and visual research: inspiration, market trends, customer preferences and needs, competing products best practices, design elements and more. We could receive those without compromising the need for transparency from our AI bots’ sources, which is crucial for informed decision-making.
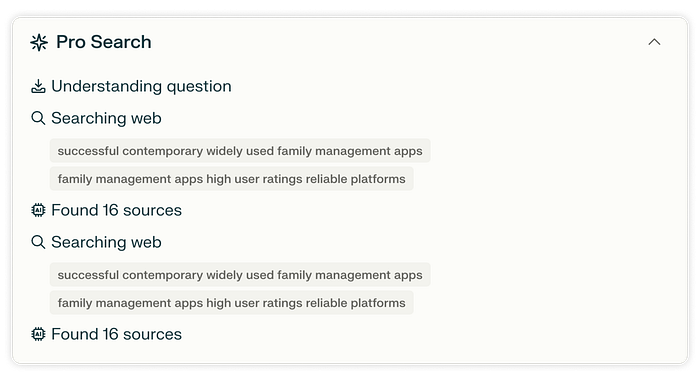
The use of Perplexity AI is very intuitive. After you’ve signed up, just enter a query in the search bar, switch on the Pro Search toggle and hit the blue arrow. The Pro Search might ask you a question in order to focus its response and provide better answers (in the free version you can use it up to 5 time before it deactivates for 4 hours). You can review its stages of work in real time, as it will communicates to you what it does. When it’s done clarifying and searching, it will supply you with direct answers, including citations, and Incorporate up-to-date data. You can review the provided answer sources in the actual answer paragraph, or in the sources sections above it. You can ask for visual result to be shared on the right, and you can also use the “Related” section to ask one of the follow-up question it suggests.
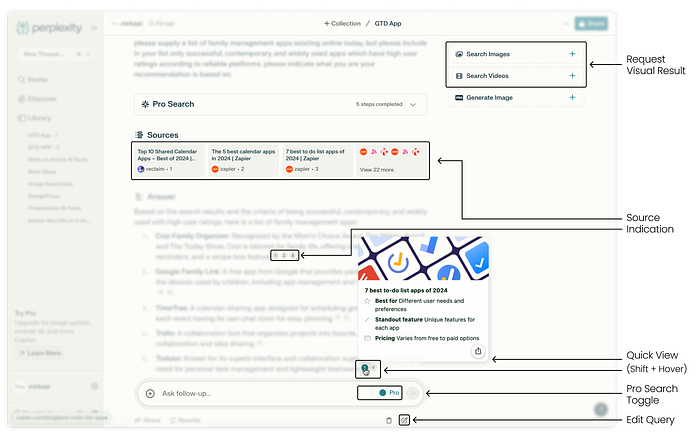
Another thing you can do is ask perplexity to summarize the content of a specific sources indication that it gave you in its response. You can do this for a specific webpage content or, if you find it relevant, for the entire domain. Additional options are uploading files by clicking the “plus” icon in the search bar (3 per a day in the free version), and, if you go for the paid PRO version, request to generate an image.
But before you do all this, if it’s a research task we are talking about, and as we wish to save time, it would be very useful to use perplexity “Create Collection” feature!
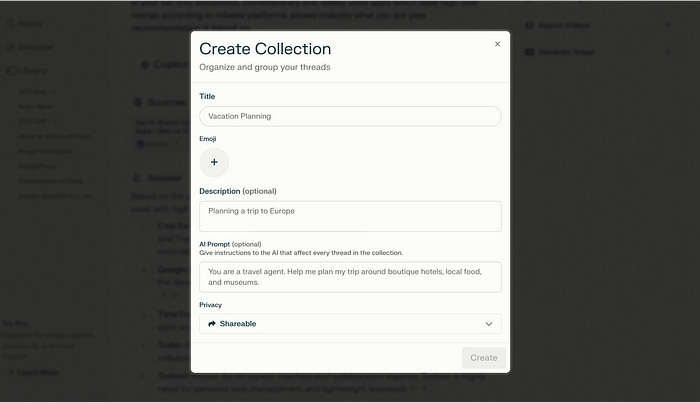
Create Collection
This feature can be used to help you organize, share and collaborate information, group threads into collections based on topics or projects, adjust privacy settings and customize AI prompts for a unified response style within a collection. But the most interesting use of a collection from our perspective is that it enable us to define 3 basis layers of our AI based research:
- Profile: telling our bot who he is, what role is he playing, what capabilities does he have, and what should be the tone of his interactions.
- Problem: telling our bot what problem is he aiming to solve, and what pain point is he addressing
- Goal: explaining the bot what do we need to know about our competing products, the market we are in, or any other data we should hold, when the research is completed.
Once we define these 3 layers in the collection, any response we get, for any of the threads in our collection, will take those instructions under consideration.
This ,of course, is also something we can ask one of our bots to help us with, but even then, we should first invest at least a few minute of independent human thought, just to avoid a snowball of mistakes that will takes us far away from our research goals.
To create collection you first need to start a thread, then, once you’re in it, just click on the “+ collection” at the top of your thread. This would also be where you name your current thread with a short and intuitive titles, that will later make navigation an orientations in your threads easy and quick. Once you’ve defined those 3 basis layers you can start creating threads and collect information.
For more on Perplexity: How to Use Perplexity AI?
So now that we have the main 2 tools, we can start collecting data for our research. Here is how we’re going to do that:
Prompting and Re-prompting
1. Define a request:
Be specific, provide context and use relevant keywords.
2. Format:
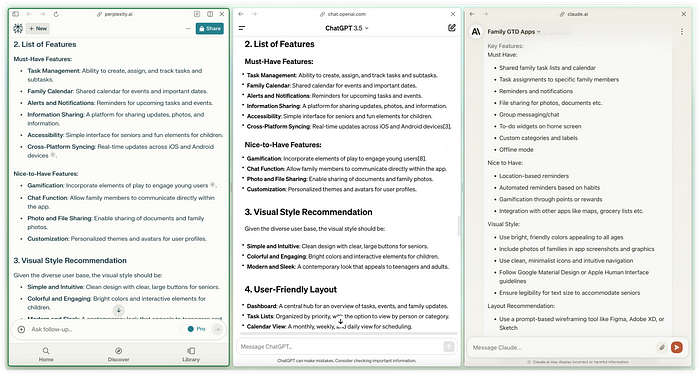
Define which format you want the response in. Consider a format that will make it easy for you to later on compare the response you get with other bots, by using the arc split view. For example request for numbered bullet point, a chart, a list of facts or questions, a list of recommendations, a TL;DR (too long didn’t read) bullets summary etc.
3. Re-prompting:
After receiving the bot’s initial response, it’s important to evaluate whether it meets your needs. Is something missing or feels irrelevant? Are there any inconsistencies or errors? If so, edit your prompt! In perplexity you don’t have to re-prompt all over again. You just click the “Edit Query” icon at the bottom of the answer section, make the necessary tweaks, click “Save” and get a revised answer, without unnecessary correspondences cluttering you conversation.
4. Use arc feature:
While collecting information don’t forget to use the advantages of arc; use the “Shift + Hove” or “Shift + Click” shortcut for a quick look at the source indications perplexity supplies for you. Use the right click and “Open Link in Split View” options to expand and dive deep. Use the notes option (can also be done in split view). Use the “command + T” shortcut, to directly ask Chat GPT for another point of view (which you can compare in the split view option), or for better phrasing of a paragraph you just drafted.
Collect Visuals
last thing you need in order to complete your data collection stage is visual information. Collecting visuals from competitors websites and apps can provide valuable insights into current design trends and user expectations. You can get some of it with the help of the “Search Images” and “Search Videos” section in perplexity, but for detailed and specific in-app visuals and screenshots you need something else.
Platforms such as screenlane.com which encompasses pageflows.com and pagecollective.com are a great option for finding a good cluster of screenshots and video of user flows for many products, however these are paid platform. Another option is axiom.ai or any other AI-powered web scraping tools, but they requires more handling and depending on the visuals you need, won’t necessarily justify your efforts.

Basically, no matter what AI tools you will use, none of them will spare you the crucial stage of at least some real active interaction with the competitors apps or platforms. However, since you’ve focused your research so far, you can manage this stage in a very efficient way as, if your prompts were properly crafted, you should know by now exactly which competitors are relevant for you, which features you should get to know, and what is missing or unique in the products you are competing with.
So while getting into this hands on interaction, it would be a good idea to collect some screenshots and add them to your visual research or inspiration board, which I am just getting to.
3rd tool: FigJam AI
You’re nearly done! All you have to do now is to get your verbal and visual data together, go over the analyzation, conclusions and recommendations one more time, to assure you confidently stand behind it, and prepare it for sharing with the relevant collogues.
What you will share and the conclusions and recommendations you will “sell” from your research, would eventually be the base of the UX and UI of this new product you’re about to design. You are now about tell what you’ve learned and concluded from your finding, explain what makes you confident about what you recommend, answer questions and convince your stakeholders. From now on a lot of money, time and efforts are about to be invested in what you think. But since you’ve verified your data, worked efficiently and performed the necessary drill-downs, you’re good to go.
There are number of AI tool you can uses in order to quickly and efficiently visualize your research, depending on the outcome you desire. There would usually be 2 main audiences (or 2 stages, depending on the company you work for) to whom you would be presenting your research.
First audience:
Hands-on colleagues (Product managers and other designers).
To whom you can present a more raw and fluid mass of data for a work in progress sessions, during which you will change it together, ask questions, have debates, build workflow and conclude action items.
For this audience I would recommend working with FigJjam AI, and it’s Jombot widget. Those tools will help you create editable, visually appealing and informative presentations of data rather quickly and with minimal effort. As in all other AI tools, the main time consuming effort would be crafting a properly plotted prompt, and then, once FigJam AI generates the relevant template for you, throwing in the right places the data you’ve collected in your research.
Here is an example for the prompt I use in FigJam for presenting my market research, you can copy it and make the adjustment to your relevant topic:
Please create 10 boards for presenting competitors research data for a new GTD \ Family management apps. The boards should be used for a work session with product managers and product designers. The boards should be titled as described in the list below, and contain relevant work element according to their titles:
1. Problem.
2. Goal.
3. Researched apps (Please divide to 2 sections: first - GTD apps, second - Family management apps).
4. List of  features (Please divide to 3 sections: first - Key features, second - common features, third - unique features).
5. Design and visualization (Please divide to 2 sections: first - Visual elements, second - inspiration board).
6. Conclusions.
7. Recommendations.
8. Additional considerations (Please divide to 3 sections: first - Privacy and security, second - Integration with voice commands, third - Usage patterns).
9. Action items.
10. Recommended work flow with a Gantt (ment for the next stages in the process which are: first - users research, second - product design work flow, third – development).
Once your prompt is ready, you just click the FigJam “AI Generate” star icon at the top left, past your prompt into the “Generate” window, hit “Generate” and watch it doing the work for you.
One very important thing to remember when working with FigJam AI is that, unless you’ve got exactly what you want in the first go, you should always try generating the same prompt at least one more time (no harm in 2 more times either). The reason is, if you’re requesting for a presentation that covers many topics and elements, FigJam is able to generate different sections and designs for you, for a similar needs. As it only takes about 2 minutes to do, if you generate twice or three time, you would be able to choose the elements that suite you best from the library it will create for you. That way you could tailor a personalized flow for your presentation.


Once you’ve done that, you will only need to “throw in” all the data and visuals you collected. If you kept your research organized, this shouldn’t take too long.
For more on how to use FigJam AI:
Step-by-Step Introduction to Figjam AI for Better Design Collaboration \ Edward Chechique
Second audience:
the second audience for your presentation would probably be the “Hands-off” colleagues (Customers, investors and other friends).
To whom we would prefer presenting well wrapped and organized data which will include un-editable final conclusion and recommendations.
For this there are many options of AI presentation platforms, but personally I didn’t find one that really saves me a proper hands-on work. Also in Figma you could find the MagicSlides.app plugin (there is also the magicslides.app platform) which is cute but very basic, and Aipres [beta] which didn’t do the job for me. So for this one I can’t yet recommend a proper AI solution. However I will say that you could use much of what you’ve got in FigJam both for your prompt (if you do find an AI presentation platform that satisfy you), and for the design of this presentation. Another thing you could do, is dive-in into the Figma community and search for a template, but that you already know.
Combining AI with your Professional Judgment
As we look toward the future of product design, the integration of AI tools is not just a trend but a fundamental shift in how we, product designers, should approach our craft. By harnessing these tools, starting from the earliest stage of our work, we shall be equipped to navigate the complexities of modern product development. However, we must always keep in mind that even though AI tools are a game-changer and can provide valuable insights and save time, they’re not perfect, and should not replace your professional judgment and experience, but be used in conjunction with them.
Here is a list of the main tools and platforms I presented in this article:
- Arc browser for a distraction free and decluttered research process.
- Perplexity AI for well phrased, well organized and verified data.
- screenlane.com for a variety of mobile apps screenshots.
- pageflows.com for a variety of user flow recordings of proven products.
- pagecollective.com for a variety of screenshots of desktop platforms.
- FigJam AI for visual organization and presentation of your research.
- MagicSlides.app for a basic presentation generating plugin in Figma.
Be responsible using those AI shortcuts, use drill-downs options to verify their information (you can now effortlessly do that with perplexity and arc), check their sources and make sure you understand what you’re dealing with. Avoid being blindly led by AI, and remember that it should always be you who leads the task, not your AI bot, as it will always be you, who will take the credits or responsibility when major milestones are achieved or missed. Think of it as reading your auto-corrected emails to your boss, before clicking the “Send” key. Will you ever click “Send” without reading it fluently, at least once?
Thank you for taking the time to read my article. I believe it will equipped you with practical and useful information on how to use AI tools to optimize your market research methodology.
If you found it useful please feel free to share it with friends and colleagues, and consider following me for updates on future publications. If you have any questions don’t hesitate to reach out or to connect with me on LinkedIn.

