Stats in spreadsheets
Formulas for normal distributions in Excel are wildly inconsistent. This cheat sheet will help you keep them straight.
I’m a former chemical engineer, software tester, programmer, and UX designer who is transitioning into quantitative UX research. I write here monthly. If you’re new to Quant UXR, check out my article How to get started with Quantitative UX Research. If you’re an expert, leave me a comment to let me know all the mistakes I’ve made in this post!
I am reading the book Quantifying the User Experience by James Lewis and Jeff Sauro. Slowly. It is a BEAST. I’m also trying to recreate all the calculations in Google Sheets. I know, I know. There are templates and Excel companions available. I don’t want that, though. I want to build the formulas by myself so that I absorb the content and can apply it in real life.
Turns out, it’s surprisingly hard to do basic statistics in Sheets and Excel. Do I use TINV or NORMSDIST? Is it one-tailed or two-tailed? There are about 25 different formulas for Normal and T distributions. There’s a lot of redundancy and the documentation isn’t helpful. I did some googling and couldn’t find any concise guides to these confusing formulas. I definitely couldn’t find anything visual.
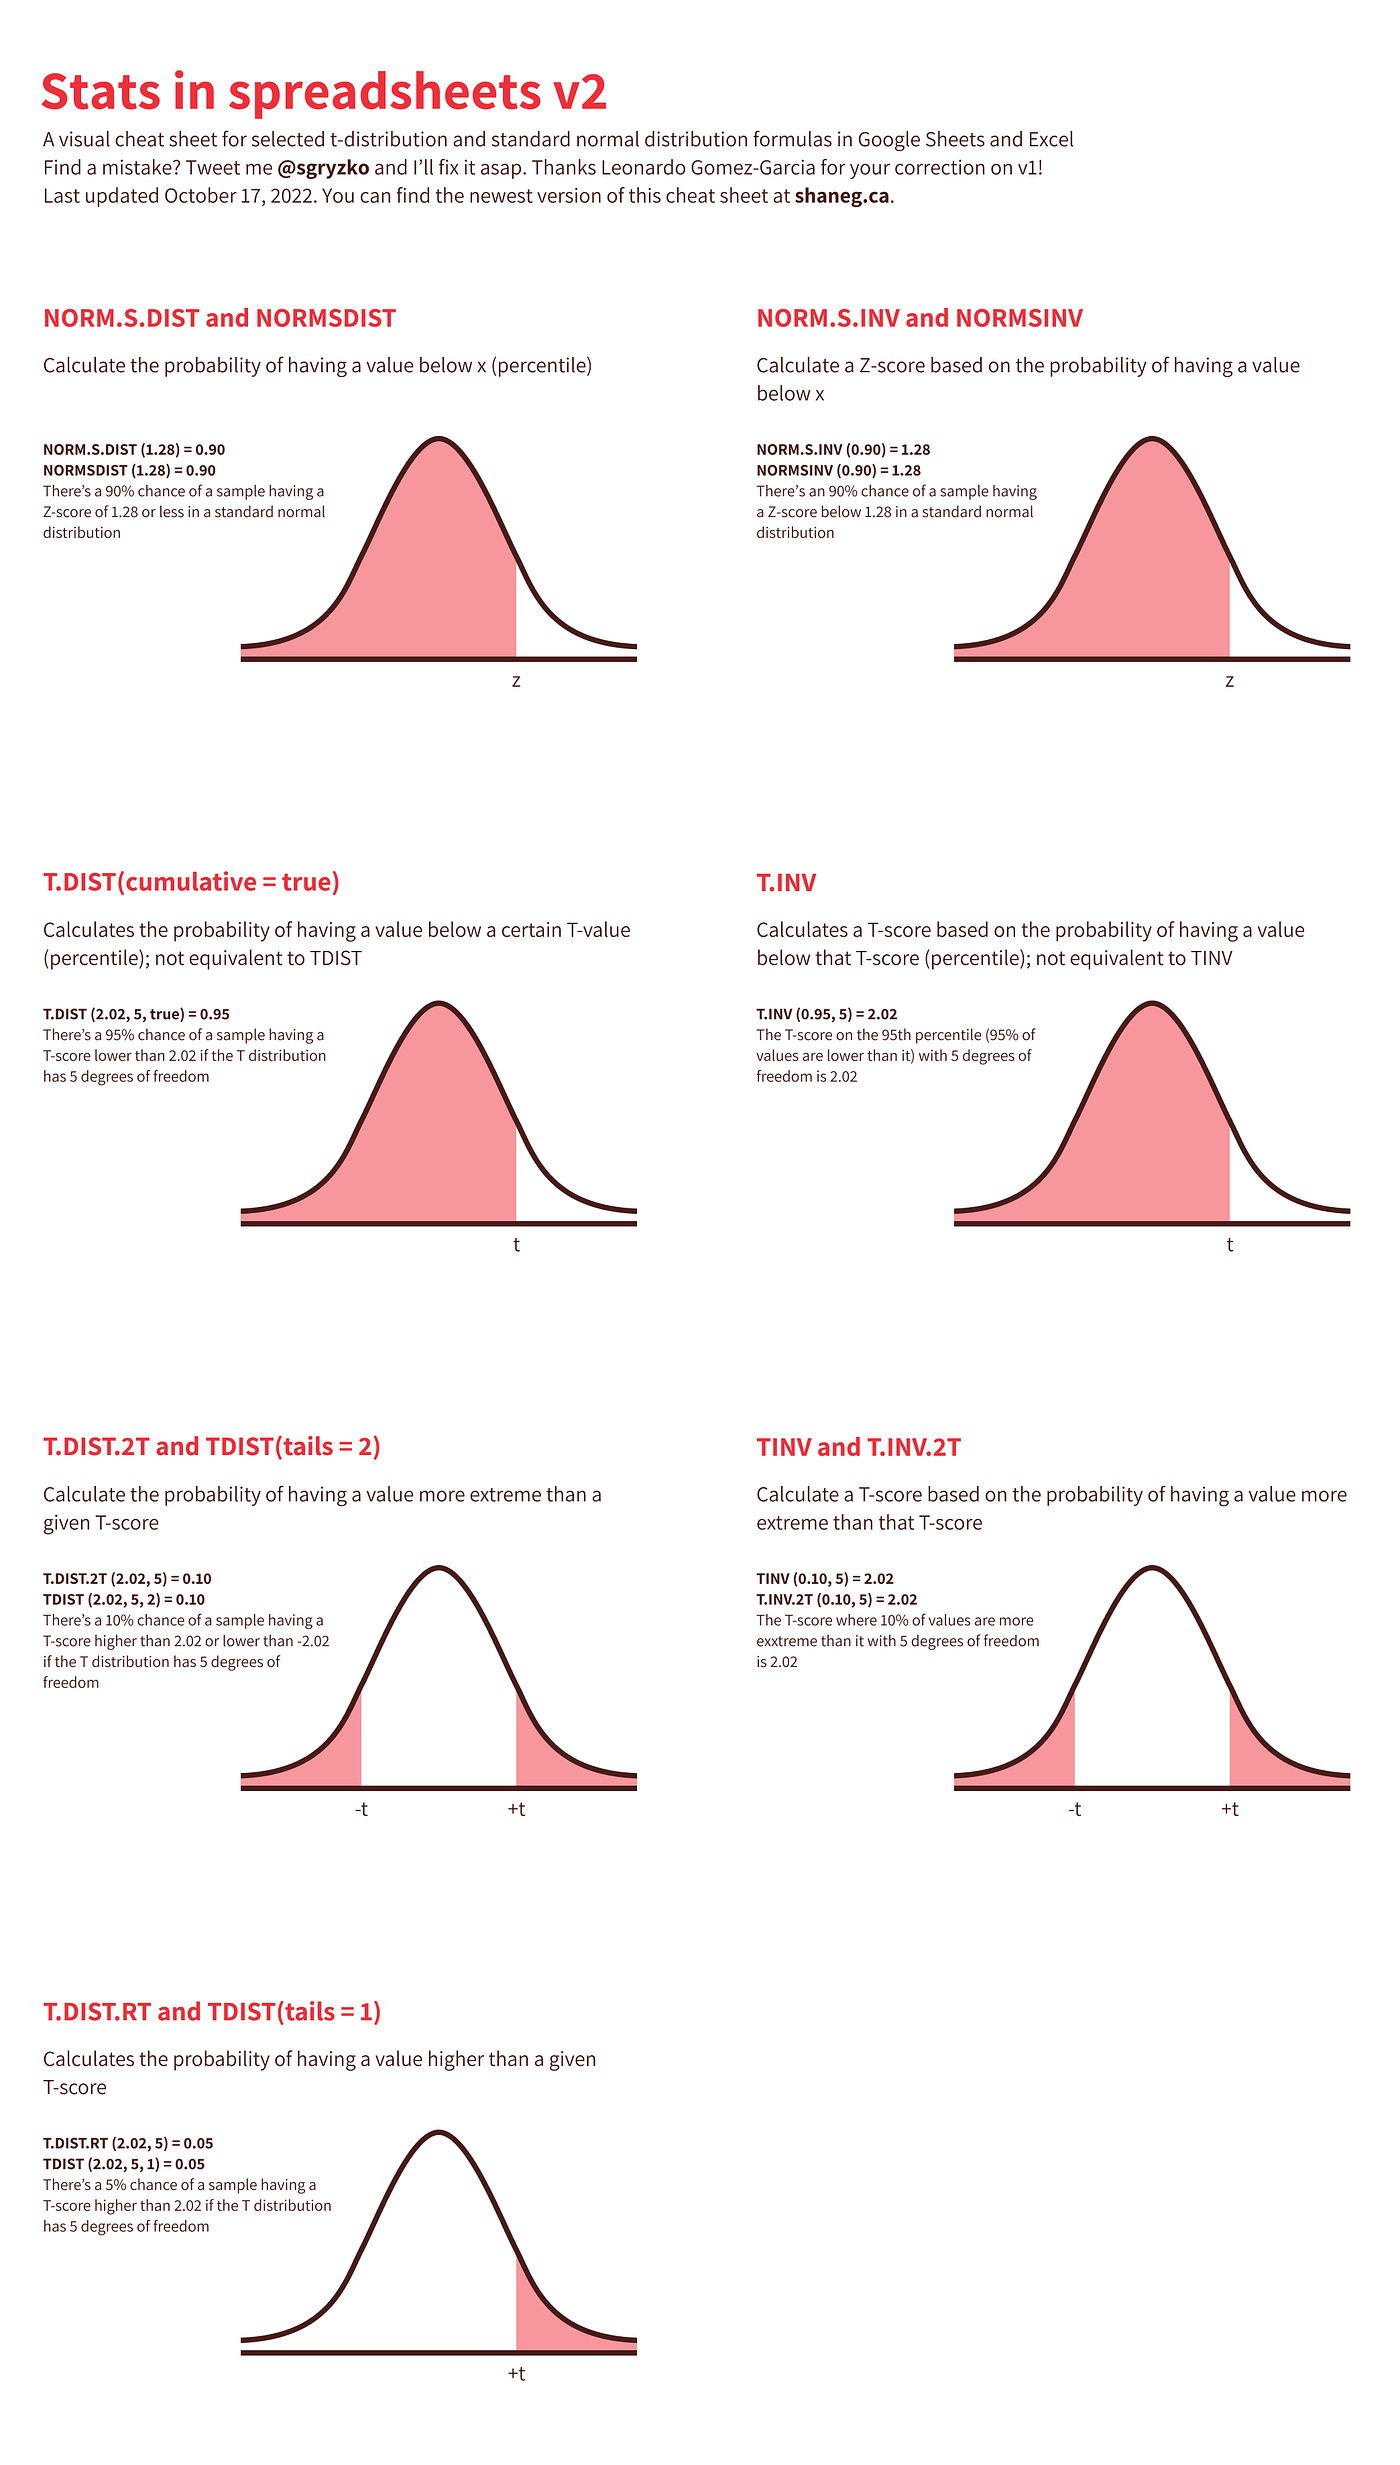
So I built a cheat sheet. I’m hoping that it will be useful for people who have learned the basics of stats but need help applying it in spreadsheets. Students, people learning quantitative UX research like me, or even people from other fields.
Check out the cheat sheet below, and please leave me a comment. Is anything confusing? Is anything wrong? Are you actually using the cheat sheet? Let me know!
Appendix 1: Cheat sheet scope
I decided to limit the cheat sheet to the following for the sake of simplicity.
Standard Normal and T-Distributions only
The standard normal and T-distributions always have a mean of 0 and a standard deviation of 1. Non-standard normal distributions can have any mean and standard deviation. I focused on standard distributions because I’ve only ever seen standard distributions when working with Quantitative UX Research (Quant UXR). Formulas for non-standard normal distributions are similar to standard normal, but without the S.
Cumulative formulas only
These distributions are also known as probability functions. Their x axis is the number of standard deviations away from the mean. Their y axis represents the probability of all standard deviations from -∞ to ∞. But in Quant UXR, we don’t usually care about the probability of one single point. We care about the probability up to a point or beyond a point. That’s what I mean by cumulative. To get that, you look at the area under the curve.
Appendix 2: Normal vs. T-Distributions
If you’re wondering when to use T.DIST vs. NORM.S.DIST, this might help.
T distributions are normal distributions with small sample sizes. They have fatter tails (in other words, they have greater chances of extreme values) because they have a smaller sample size. Sample size relates to degrees of freedom. When the degrees of freedom of a T distribution is 30 or higher, it’s essentially the same as a normal distribution. The x-axis of both of these distributions is number of standard deviations away from the mean.
Originally published at http://shanegryzko.wordpress.com on April 1, 2021.

