Quantitative UX Research Methods
Improve your User Experience with Quantitative UX Research
What is Quantitative UX Research? (For Beginners)
Quantitative UX research is the research strategy that focuses on quantifying the collection and analysis of numerical data. It can be used to find patterns and averages, make predictions, test causal relationships, and generalize results to wider populations.
Why do we need Quantitative UX Research?
Many product companies focus on qualitative research to understand their user experience. However, when comes to understanding user behavior on a larger scale, quantitative UX research is inevitable.
Quantitative UX Research is Inevitable!
Also, quants research make sure that the insights/results you derived in primary research & secondary research are not likely to occur randomly or by chance but instead likely to be caused by a specific reason/factor. (i.e Statistical Significance)
Typical UX Research Questions and its Quantitative Research Approaches
- How do people interact with Technology?
- Funnel Analysis
- Sequence analysis/Longitudinal Log Analysis
2. What type of people uses certain technology? What is difficult for these people to do with a certain technology?`
- Clustering/Classification methods
3. What are people’s attitudes and perceptions of certain technology? How do different designs affect attitude/thoughts and behavior?
- Sentiment & Intent analysis
- A/B testing
4. How can we add value and improve people’s lives with technology?
- Data-driven prioritization of needs & objectives
Quantitative UX Research Methods
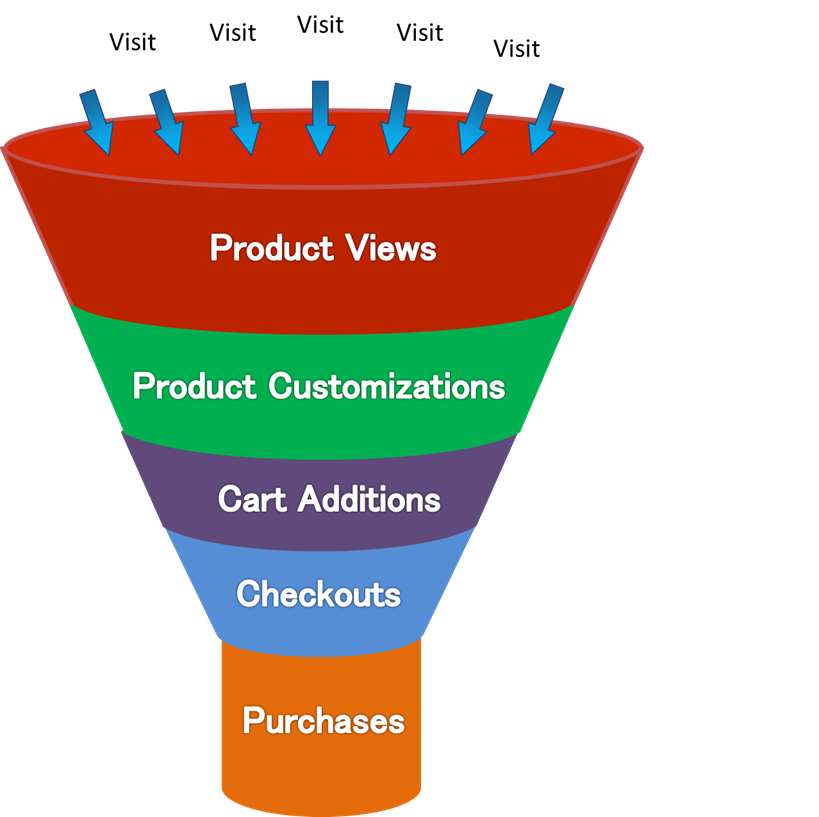
1. Funnel Analysis
The term ‘funnel analysis’ comes from the analogy with a physical kitchen or garage funnel, which gets narrower along its length, allowing less volume to pass through it.
Similarly, an analytics funnel helps visualize how a large number of individuals enter the funnel, yet only a small proportion of them will perform the intended actions and reach the end goal on a website, eCommerce platform, application, or online game.

By continuously monitoring and analyzing funnels, it is possible to assess if changes to an application or platform are having a positive effect on conversion. Because it helps determine the point at which users are dropping off. The next step is to understand why they’re dropping off, in order to reduce drop-off rates and in turn increase overall conversion.
However, it’s worth noting that consumers nowadays are having a more dynamic journey. Instead of just narrowing their options, they widen the resources to help them make a decision. And when they finally make a purchase, consumers share their opinion of the brand, regardless if it’s good or bad. They also set a standard based on their best brand experience and this affects their brand relationships and overall journey.
2. Sequence Analysis
In social sciences, sequence analysis (SA) is concerned with the analysis of sets of categorical sequences that typically describe longitudinal data.
Analyzed sequences are encoded representations of, for example, individual life trajectories such as family formation, school to work transitions, working careers, but they may also describe daily or weekly time use or represent the evolution of observed or self-reported health, political behaviors, or the development stages of organizations.
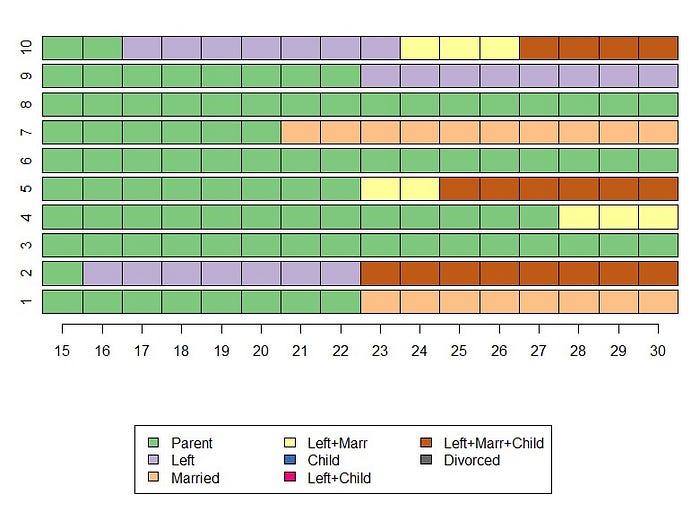
The above image projects Typical American family life sequences. First, they stay with their parents, then they left home, then married, then they get a child, then so on.
SA is a longitudinal analysis approach that is holistic in the sense that it considers each sequence as a whole. SA is essentially exploratory. Broadly, SA provides a comprehensible overall picture of sets of sequences with the objective of characterizing the structure of the set of sequences, finding the salient characteristics of groups, identifying typical paths, comparing groups, and more generally studying how the sequences are related to covariates such as sex, birth cohort, or social origin.
3. Clustering/classification methods
Clustering and classification are machine learning methods for finding the similarities — and differences — in a set of data or documents. These methods can be used for such tasks as grouping products in a product catalog, finding cohorts of similar customers, or aggregating sets of documents by topic, team, or office.
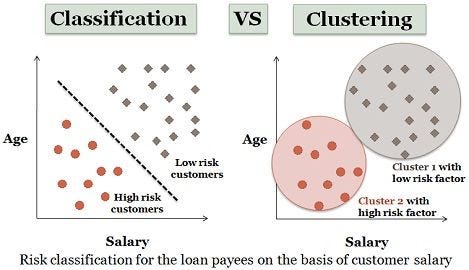
Classifications take a set of data that you’ve already manually analyzed and labeled and use that to train a learning model to then examine a set of new data. This is called supervised learning.
Clustering, on the other hand, doesn’t require an existing data set that’s been labeled by humans but still tries to find the groupings and differences in the data. This is called unsupervised learning.
Without clustering algorithms and classification techniques, the Analysis of large data sets becomes watered down and non-specific, then researchers have to spend too much time manually adjusting relevancy and precision. Let machine learning do the work so you can focus your time and resources where they matter most.
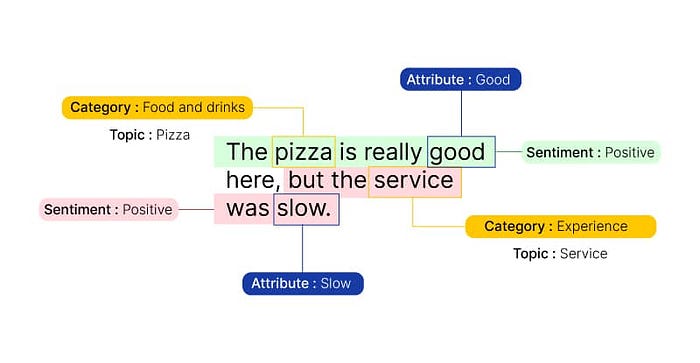
4. Sentiment & Intent analysis
Sentiment analysis is contextual mining of text which identifies and extracts subjective information in the source material and helps a business to understand the social sentiment of their brand, product, or service while monitoring online conversations.
With the recent advances in deep learning, the ability of algorithms to analyze text has improved considerably. Creative use of advanced artificial intelligence techniques can be an effective tool for doing in-depth research.
As a Quantitative UX researcher, it is important to classify incoming customer conversations about a brand based on the following lines:
- Key aspects of a brand’s product and service that customers care about.
- Users’ underlying intentions and reactions concerning those aspects.
These basic concepts when used in combination, become a very important tool for analyzing millions of brand conversations with human-level accuracy. In the post, we take the example of Uber and demonstrate how this works.

Sentiment & Intent Analysis focuses on analyzing an incoming message and tells whether the underlying sentiment is positive, negative, or neutral and also the user’s intention behind a message and identifying whether it relates to an opinion, news, marketing, complaint, suggestion, appreciation or query.
Check my Blog “Sentiment Analysis” in Google Colab using ChatGPT.
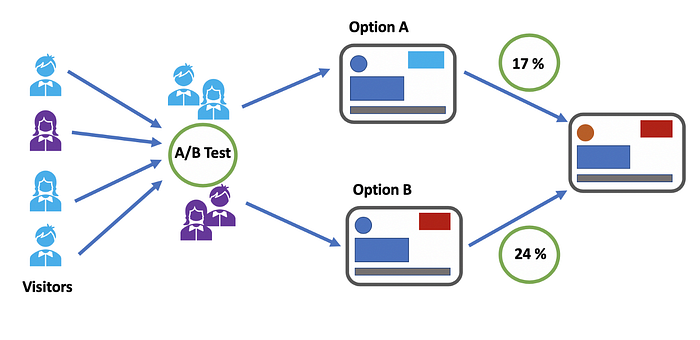
5. A/B testing
A/B testing is a user experience research methodology of comparing multiple versions of a feature, a page, a button, headline, page structure, form, landing page, navigation, pricing, etc. by showing the different versions to customers or prospective customers and assessing the quality of interaction by some metric (Click-through rate, purchase, following any call to action, etc.)
Instead of choosing a feature that you think might work, you can use an A/B test to know what works.
This is becoming increasingly important in a data-driven world where business decisions need to be backed by facts and numbers.
Feel free to contact me on
LinkedIn: https://www.linkedin.com/in/isanthoshgandhi/
Twitter: https://www.twitter.com/isanthoshgandhi/
Try my book “Notes of Unconventional UX Researcher” which is a compilation of my articles on Design Thinking, Systems Thinking, and UX Research.

US: https://www.amazon.com/dp/B0B8TR339W
UK: https://www.amazon.co.uk/dp/B0B8TR339W
India (Ebook only): https://www.amazon.in/dp/B0B8TR339W

