Prioritization involves more than simply arranging features in a specific sequence. Its primary focus lies in integrating various sources of product insight and research into a unified direction. The most difficult aspect of a product manager’s role often revolves around refining and committing to a narrowed-down list of demands and feature requests on the roadmap.

In an ideal scenario, effective quantitative prioritization frameworks provide a means to impartially assess and allocate priorities, transcending the influence of dominant individuals.
By utilizing scores, rankings, charts, and matrices composed of data-driven values, these frameworks transform data and strategic insights into logical estimations that foster alignment among all stakeholders. This approach facilitates a fair and objective decision-making process, allowing everyone involved to converge on a shared understanding of priorities.
Why we should care about Quantitative prioritization frameworks?
Quantitative prioritization frameworks are valuable because they bring objectivity and data-driven decision-making to the prioritization process. They provide clarity for individuals like yourself by assigning numerical scores or rankings to options, making it easier for you to determine which ones are most important.
This saves you time and resources by offering an objective and consistent approach to decision-making. These frameworks foster alignment for you by facilitating discussions and consensus-building around common goals.
I. RICE
RICE is Intercom’s way of prioritizing ideas within its product teams. It helps them focus on the initiatives that have the greatest potential to achieve their goals. With RICE, they evaluate each feature or initiative based on four important factors: reach, impact, confidence, and effort. Let’s break down what each factor means and how they are measured:

Once the individual numbers are determined for each factor, they are combined using a formula to generate an overall score. This score provides a standardized measure that can be used for any type of initiative when prioritizing items for the roadmap.

Once you calculate the RICE score for each feature, you can use it to determine the priority order for building them. Let’s take a look at an example:

Pros ✅
- Provides a structured approach for consistent decision-making.
- Considers multiple factors, including reach, impact, confidence, and effort.
- Promotes transparency and alignment within teams.
Cons 🚫
- Oversimplifies complex factors into numerical scores.
- Subjective judgment can influence scoring.
- Focuses more on short-term impact, and may overlook long-term implications.
II. Kano
The Kano model uses a simple plot with two sets of parameters. On the horizontal axis, we have the implementation values, which determine how well a customer’s needs are met. These values can be categorized into three buckets:

The Kano model uses a vertical axis to represent customer satisfaction levels. It ranges from needs not being met on the left to needs being fully met on the right. To gather this valuable customer insight, you can create a Kano questionnaire.
This questionnaire asks customers how they would feel with or without specific features, helping you understand their preferences and expectations.

The core concept of the Kano model is simple: the more you invest your time, money, and effort in creating, innovating, and improving features within each bucket, the greater the level of customer satisfaction will be. In other words, by focusing on enhancing the features that customers value the most, you can significantly increase their overall satisfaction.

Pros ✅
- Customer-centric approach.
- Understanding of customer satisfaction levels.
- Resource optimization.
- Guidance for innovation.
Cons 🚫
- The complexity of analysis.
- Subjectivity in categorization.
- Limited to current customer insights.
- Lack of quantitative metrics.
III. Opportunity scoring
Opportunity scoring, also known as opportunity analysis, is a prioritization method based on Anthony Ulwick’s Outcome-Driven Innovation concept. According to Ulwick, customers purchase products or services to accomplish specific tasks or “jobs.” While customers may not be adept at proposing solutions, their feedback is valuable. Product teams utilize this feedback to define desired outcomes for products or features.

In opportunity scoring, a Satisfaction and Importance graph is used to assess and rank opportunities. Once a list of desired outcomes is generated, customers are surveyed to gather their input. The following questions are commonly asked:
- How important is this outcome or feature? Ask your customers to rank them.
- How satisfied is the customer with the existing solutions?
By analyzing customer responses, the product team can prioritize opportunities based on satisfaction and importance, helping them focus on areas that will have the greatest impact on customer satisfaction and meet their needs effectively.

Once you plot the answers on the chart, you’ll be able to identify the features that matter most to your customers (the outcomes) but currently have low satisfaction scores within your product. These are the features that need immediate attention and will be prioritized for your next sprint.
Pros ✅
- Identification of high-impact opportunities
- Uncovering hidden potential
- Data-driven decision-making
Cons 🚫
- Reliance on customer input
- Subjectivity and interpretation
- Lack of broader context
- Limited to current user insights
Opportunity scoring is a powerful prioritization method that helps uncover hidden potential in current features. It enables us to identify features that may be undiscoverable to users, not fully utilized, or in need of improvements. By applying opportunity scoring, we can uncover valuable opportunities to enhance user experiences and maximize the value our product delivers.
IV. Story mapping
The story mapping method is a simple and user-focused approach to prioritizing product features. Instead of relying solely on internal opinions, it helps you understand the user’s journey through your product.
Imagine a horizontal line where you create different stages that represent each step of the user’s experience. From signing up to setting up their profile and using specific features, you can visualize how customers navigate your product.
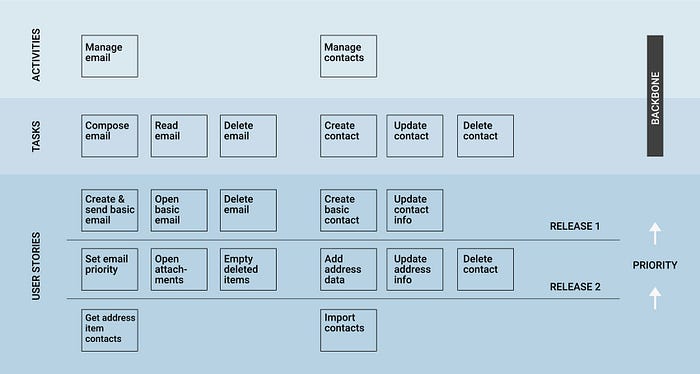
Next, along a vertical line, you place these tasks in order of importance, from top to bottom. This prioritizes the features you’ll focus on. For tasks that can wait, you can label the bottom section as “Backlog items” to put them on hold.
To bring it all together, you draw a line across these stories, dividing them into releases and sprints. This helps you plan and organize your work effectively.
By using the story mapping method, you gain a clear understanding of the user’s journey, prioritize features, and structure your product development process for successful releases and sprints.

User Story Mapping can be used in both agile and classic procedure models, regardless of the chosen method. It can be used, for example, for medium to long-term planning within the framework of agile structures, in project management to visualize the project status in an up-to-date and transparent manner, in process management to develop the process map and in requirements engineering to formulate requirements in a common language between different organizational units.
Pros ✅
- Visual representation
- Collaboration and shared understanding
- Effective feature prioritization
- Adaptability to changing requirements
Cons 🚫
- Time-consuming
- Complexity in breaking down features
- Stakeholder alignment challenges
- Limited granularity in technical details
Tip 1: Your user stories are hypotheses based on estimates and research, so make sure they’re worded as testable assumptions.
Tip 2: Promote open discussions on feasibility, viability, and desirability, with a designated moderator to facilitate and track the conversations.
V. Cost of delay
Cost of Delay, as defined by Joshua Arnold, is a way to understand the impact of time on achieving desired outcomes. It helps answer important questions:
- What is the value of having this feature in the product right now?
- How much more valuable would it be if this feature is developed earlier?
- What would be the cost if this feature is delayed beyond the planned timeline?
Assigning a monetary value to each feature involves calculating the required time and team effort for development. Additionally, you and your team can also assess the value of features based on their potential worth once they are built.
Let’s imagine you have two features: Feature A and Feature B. Feature A costs you $30,000 for every week it’s delayed, and it will take three months to build. On the other hand, Feature B costs $10,000 for every week it’s delayed, and it will also take three months to build. In this prioritization framework, your team would prioritize Feature A since it carries a higher cost of delay.

Pros ✅
- Alignment with business goals
- Data-driven decision-making
- Minimized opportunity costs
Cons 🚫
- Complexity in estimation
- Subjectivity in assigning values
- Limited scope
- Ongoing refinement required
Tip 1: Remember that cost isn’t just about money. Other things to consider are the impact on customer satisfaction, market share and brand perception.
Tip 2: Cost of delay is about estimating the cost using hypotheses. Knowing that, it’s best to underestimate than overestimate the effort, time and cost any given feature will require in order to be built.
Conclusion
Quantitative prioritization frameworks provide valuable tools for product managers to make informed decisions about feature prioritization. By leveraging methods such as RICE, Kano, opportunity scoring, story mapping, and cost of delay, teams can effectively assess and prioritize features based on factors such as impact, effort, user satisfaction, time sensitivity, and business value.
These frameworks enable teams to optimize resource allocation, focus on high-value features, and align with strategic objectives, ultimately leading to improved product outcomes and customer satisfaction. Incorporating quantitative prioritization frameworks into the product development process can enhance decision-making, foster cross-functional collaboration, and drive successful product launches.
Resources
https://www.intercom.com/blog/rice-simple-prioritization-for-product-managers/
https://www.productplan.com/glossary/kano-model/
https://www.qualtrics.com/experience-management/research/kano-analysis/#:~:text=The%20Kano%20Analysis%20model%20(pronounced,can%20be%20measured%20and%20explored.
https://www.productplan.com/glossary/story-mapping/
https://adaptmethodology.com/cost-of-delay/
https://medium.com/uxr-microsoft/what-is-the-opportunity-score-and-how-to-obtain-it-bb81fcbf79b7
https://airfocus.com/glossary/what-is-opportunity-scoring/
https://www.justinmind.com/blog/user-story-mapping/
https://www.nngroup.com/articles/user-story-mapping/#:~:text=Definition%3A%20User%2Dstory%20mapping%20(,goals%20in%20a%20digital%20product.

