Measuring the User Experience: Types of metrics in the User experience
We will discuss how to measure and quantify user experience in this article. Why is it important to measure it? Learn how to calculate a realistic project that will help you start applying it to your project.
Let’s first understand: what is metric?
In the simplest terms, it is a technique for measuring or evaluating a specific phenomenon or thing.
Which one, for instance, is longer? To define it, we use distance, or which is taller or faster? We measure things using height and speed.
Thus, the metrics used here are distance, height, and speed.
What is UX Metric exactly?
UX metrics reveal something about the interaction between the user and the product.

What is something?
Something = quantitative value
It is about the interaction between the user (human) and the product, which can be measured and quantified. Quantity of the user’s emotions, attitudes, behavior, perception, etc., about the product

Metrics are important because they allow you to understand how your products are being used and what problems users encounter while using them. You can use these metrics to improve your products and make sure that your users have an amazing experience!
Types of UX Metrics
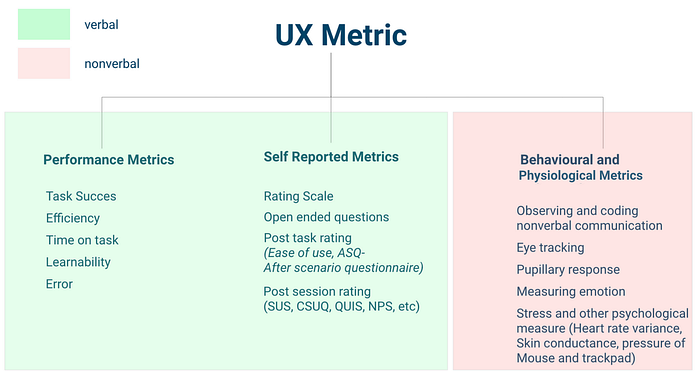
User experience metrics can be broken down into three types:
A. Performance Metrics: When user is performing or interacting with something we try to understand how efficiently they are completing the task. Example: Time on task, Efficiency, Error rate, etc.
B. Self Reported Metrics: To understand users’ perceptions, while they are interacting with the product or afterward. Example: SUS, NPS, ASQ, etc.
C. Behavioural and Physiological Metrics: To understand users’ physiological, unconscious behaviour and their nonverbal communication. Example: Eye tracking, Measuring Emotions, GSR, etc

Below I’m sharing a few examples of them;

Dr. Albert Mehrabian’s 7–38–55% Rule

According to Albert Mehrabian’s 7–38–55 communication model, we communicate feelings and attitudes in spoken communications in 7% of cases through the words we use, in 38% of cases through the tone and voice we use, and in 55% of cases through the body language we exhibit (specifically our facial expressions).
Therefore, it should be clear why verbal and nonverbal communication are both crucial for understanding users. The image below shows the metrics that fall under verbal and nonverbal human behaviour.
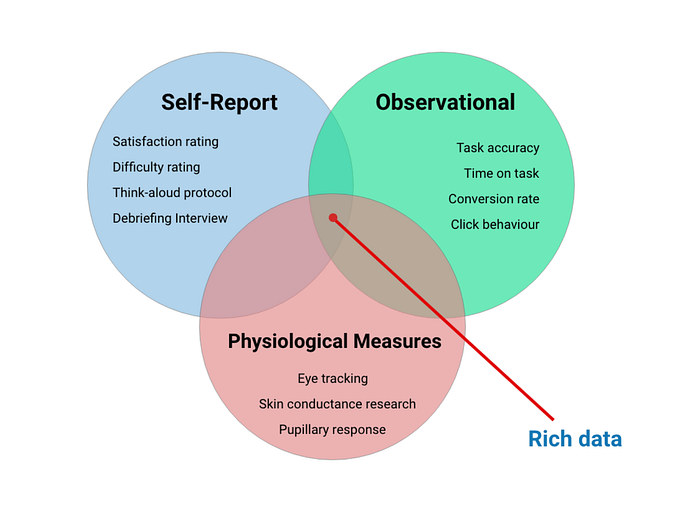
Combining performance metrics with self-reported metrics and physiological metrics is a best practice because it gives you rich data from various sources and increases the validity of your research.
Explanation with Real Case Study for Usability Test
Here we will be measuring the user experience with a real-time example.
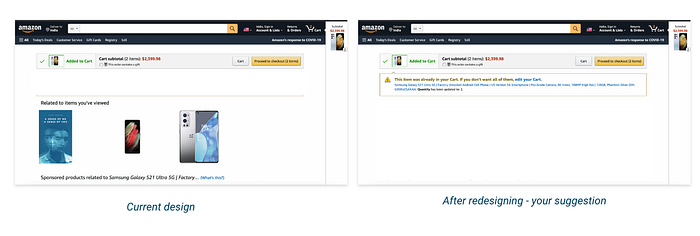
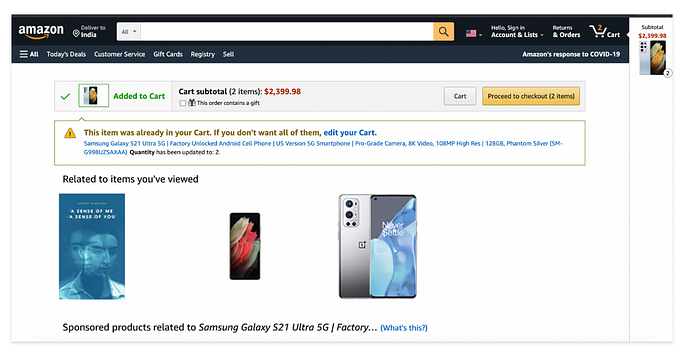
Let’s say Alex, a designer at Amazon, She and her team noticed some UX problems with the current design, so she came up with a new version of it and proposed it to the group, explaining that they should take the proposed design into consideration.
I’m sure you’ve all been on this journey and may have run into pushback and disagreement, so when you suggest any changes to border panel members or other stakeholders, In this scenario showing data is more persuasive while you explain and measuring UX could be useful as one strategy to support your design.
So Alex decided to measure the UX, here are steps to measure the UX;

Step 1; Identifying the goal:
- She wanted to know which design is most efficient for the target user?
Step 2; Select the relevant UX metrics:
- Let’s look at how to choose the ideal UX metric for this study; we know she wanted to know which design is the most efficient. So, what exactly is efficiency in UX?
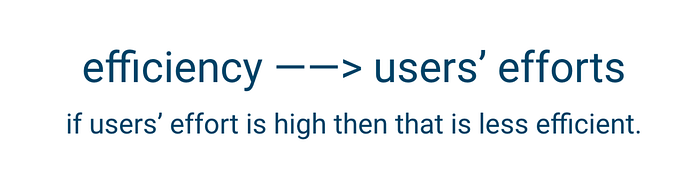
- What is the user’s effort now? This is about the in this context, when a user purchases an item here, how much effort will be required to complete the goal?
To achieve the goal, the user must first think about the action and then execute it.
So there are two kinds of effort;
A. Cognitive effort
B. Physical efforts
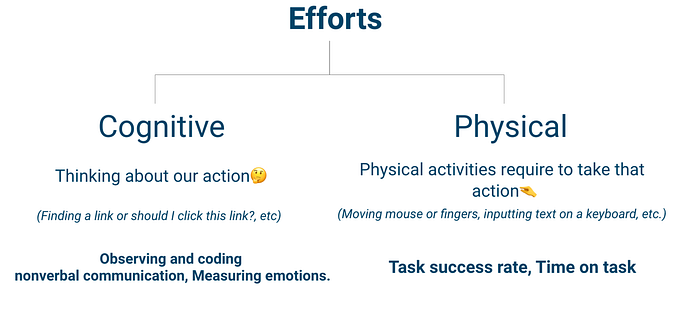
In the above image, we have also identified certain possible UX metrics that will allow us to measure 🧠 Cognitive effort, 🤌 Physical efforts such as observing and coding nonverbal communication, and so on. Emotional measurement, Task success rate, Time on task.
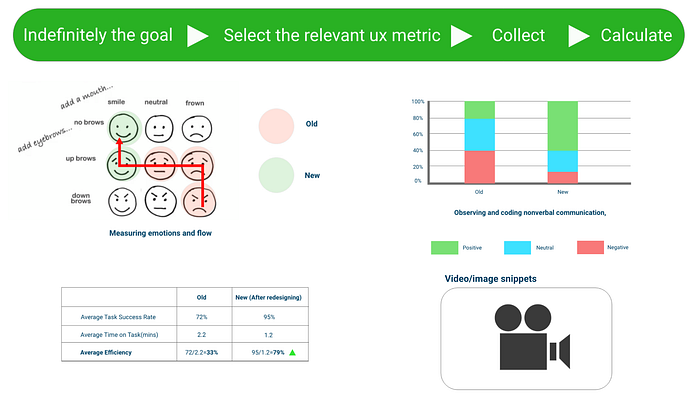
Step 3; Collect:


Step 4; Calculate:
If you have a basic understanding of math, that should be sufficient for you to calculate the value of user experience. Let me demonstrate how to do this.

As a result of the Task success rate and time on task data we gathered during the usability test, it is now time to average them out and compare their values. Since our ultimate objective was to determine the design’s efficiency, we used the formula Average Efficiency = Average Task Success Rate / Average Time on Task. This indicates that the new design is (79% — 33%)=46% more efficient for the target users.
It is more persuasive and people will understand the significance of your suggested solution if you combine all the data and make a story to support your points to the team.
The Take-Away
- Performance Metrics: When user is performing or interacting with something we try to understand how efficiently they are completing the task. (Example: Time on task, Efficiency, Error rate, etc)
- Self Reported Metrics: To understand users’ perceptions, while they are interacting or after with product. (Example: SUS, NPS, ASQ, etc)
- Behavioural and Physiological Metrics: To understand users’ psychological, unconscious behaviour and their nonverbal communication. (Example: Eye tracking, Measuring Emotions, GSR, etc)
- Steps of Measuring Users Experience are, Identifying the goal ► Select the relevant UX metric ► Collect ► Calculate
- Gather data and tell a compelling story to illustrate the importance of design and user experience.
References & Where to Learn More
Thank you :)
Clapping shows that you care, press the 👏 to share this article with others!

