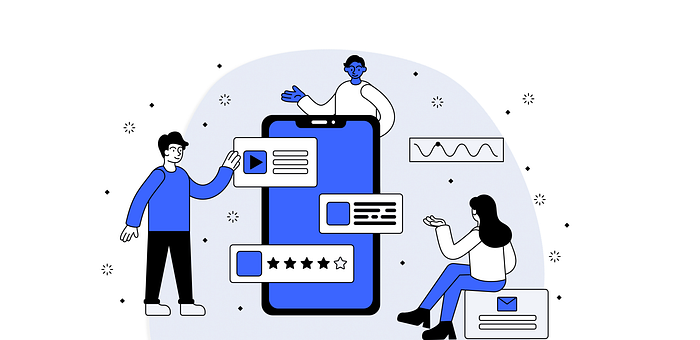
How do you measure success as a UI/UX, Product designer? — KPIs, NPS

The true description of success for every designer should be in the happiness and satisfaction of your client and testimonies of its impact on their end- users.
As a designer, you might find it gruelling to understand the worth of your designs, how priceless they are, and how to measure their success regarding business targets. In this article, I’ll shed further sapience into the Key Performance Index (KPI’s) and Net Promoter Score (NPS) you can use to measure your success as a designer and how to go about using them.
How to Measure UX: Core KPIs for Tracking Success
When first deciding which crucial performance indicators (KPIs) to concentrate on, it helps to work backward from your end targets. Your metrics should be defined by your objects. So, if you’re looking at the question of user experience optimization, begin by observing user interaction with your product and identify any jam-ups or roadblocks.
Afterwards, once you know what the problem is, you can take a step back to see what can be done to streamline UX at that step. Some of the most usual behavioral metrics you might look at to measure UX success include time on task, completion rates, retention, adoption, and error rates.
1. Error circumstance rate
Human error circumstance rate tracks how frequently users make a mistake during a specific task. Measuring error rate can help you understand where users are battling with your product, which can be used to help guide future product updates and design conclusions.
Tracking error rate helps you answer this kind of questions:
- Are there ways to simplify the task to minimize or even forestall usual errors from happening?
- Is the interface too complicated?
- Is there a need for better education or training?
By taking note of common mistakes users make, this metric allows you to see how the software or platform could be redesigned to minimize error. For example, if users constantly make mistakes filling out a form, it could be that the fields do not easily indicate how to format the required information. Or perhaps the form is too long, causing users to skip over certain fields.
2. Average Time on Task
This KPI tells you how long a user spends completing a particular task. Generally speaking, the more snappily users can complete a task successfully, the better the overall UX. However, consider breaking this metric down into two parts if you want to get more specific data on how customers use your product: Average length of task completion on first attempt and average length of task completion on repeat attempts.
Note that this breakdown is particularly valuable for repetitious tasks that the user must complete repeatedly. So, you wouldn’t look at first attempt vs. reprise attempts when measuring on-boarding or registration, since each user should only go through each of those processes at a time. Still, you could definitely measure how long it takes the average user to complete on-boarding and make adjustments to streamline the process as much as possible.
3. Adoption
This metric focuses on the increase in new users gained over a specified time period. This can be predicated on the number of accounts created in a particular time range. This provides sapience into how speedily your product is growing or how multiple customers are trying out a new feature. However, it could be that users don’t see the new feature as valuable and there might not be a need for it, if no one uses a new feature when it’s launched. Meanwhile, there might be an issue with your navigation system or a need for better user education.
4. Retention
This classification deals with the number of users returning to use the product. For instance, how much active users from a given time are still present in some later period? You may be more interested in measuring the churn rate. Looking at retention rates helps distinguish which features to prioritize and clarify the best next path on your product road map. For example, if people access a new feature as soon as it’s live but also never use it again, it’s glaring that they’re conscious of the feature but either don’t find it useful or fun to use.
5. Task Success or Completion
The number of accomplished or completed actions is a key metric to measure success as a developer. this metric reveals what percentage of users complete each step in a user flow. It’s easiest to measure completion rate for defined tasks that have a clear beginning and end. For example, if you ’re measuring the success rate for registration, it’s clear when users fail to complete it because they simply exit the operation before creating their account. While this metric does not really diagnose an issue, it does let product designers see where users are having difficulty. It could be that users go off at a confusing point, when too much work is needed, or when the next step is not seamlessly understandable. A low task completion rate signals that you need to redesign and work on that part of your user flow.
Collecting User Feedback (Quantifying UX)
Collecting user feedback is the best method to quantify UX, to get the full view of the user experience, you need to go straight to the source. Collecting user feedback helps quantify aspects of the user experience that can’t be tracked automatically — like what users suppose of your product as a whole as well as specific relations and features.
Metrics grounded on user feedback are frequently referred to as attitudinal KPIs, because they quantify how a user feels about the product experience( rather than exactly how the interactions play out).
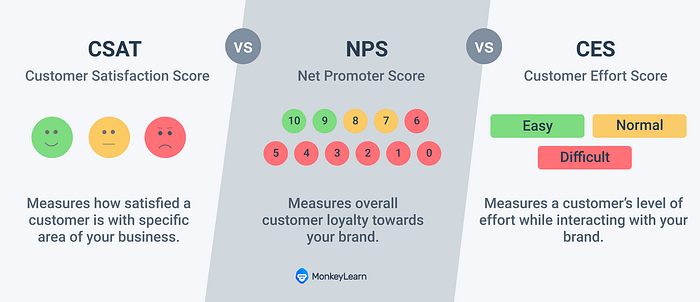
1. Net Promoter Score (NPS)
This score measures consumer satisfaction through their willingness to recommend the company’s products to others.
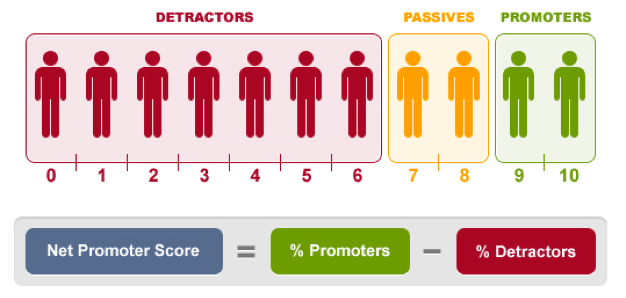
Whether or not a user would recommend your products and services tells you not only maybe they plan to continue using it, but whether if they ’re happy enough to go out of their way to promote your product by themselves. NPS measures customer satisfaction through three metrics;
- Promoters: Customers in this segment score between 9–10. These people are devoted enthusiasts who’ll keep purchasing and referring others.
- Passives: Those between 7–8. They’re satisfied but neutral customers and are susceptible to offerings from competitors.
- Critics: These are folks that score between 0–6. They’re frequently dissatisfied and discontented customers who can damage your brand and obstruct growth through negative reviews and testimonials.
Net Promoter Score can be calculated by deducting the percentage of detractors from the percentage of promoters.
NPS = Promoters — Detractors
For instance, in a pool of 1000 users, if 10% of repliers are detractors, 20% are passives, and 70% are promoters, your NPS score would be 700–100 = 600.
To add, NPS depends on collecting numerous ratings from individual users. NPS can be carried out using market research survey generally done by emails with comprehensive responses. Creating an NPS survey is fairly easy to make, but you must think of the long- term data use when deciding how you’ll manage them.
What’s a good NPS score?
Net Promoter Score is always expressed as a number from -100 to +100; and given the available -100 to +100 range, any score above 0 reads as ‘ good ’ because it indicates that a business has further promoters than detractors.
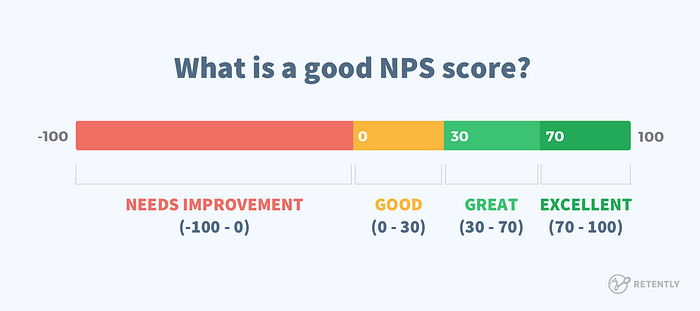
Large companies should generally have an NPS of 70 and over. According to a survey carried out in 2018, Netflix got an NPS of 64, PayPal scored 63, Amazon 54, Google Inc 53, and Apple scored 49.
A perfect score of 100 indicates that every survey replier would recommend a company to someone else, a score that nobody to my knowledge has ever achieved.
2. System Usability problems
This usability metric focuses on usability problems that happen at any phase of the interaction process. These issues can be identified when users
- Handpick the wrong links
- Misinterpret content
- Express frustration
- Miss out on the aimed targets
- Don’t execute the task because of an application behavior
- Have an inaccurate sense of task completion
How to measure it: Identify how numerous usability problems happen in each user testing group, as well as the user group that encounters the topmost number of problems. Conduct interviews with the users and ask them why they’re encountering this problem to gain a clear sapience into the current usability problem.
Usability problems happen in different user groups for different setting. Designers should keep a close eye on all the usability issues that happen during testing and follow up on the points of the application that caused user’s trouble.
System usability scale (SUS): The system usability scale(SUS) involves a questionnaire that helps product designers quantify how easy their product is to use and how successfully it serves its purpose.
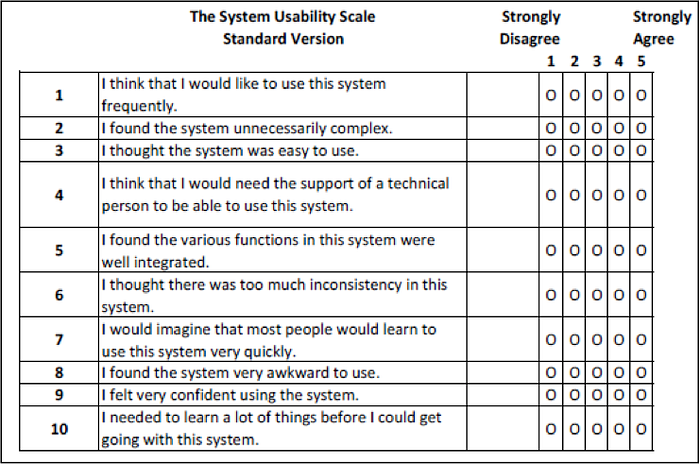
The original SUS questionnaire, produced by John Brooke in 1986, asks users to rate a series of statements on a scale of 1 to 10, the SUS is designed to discover users feelings about a product’s user experience, features, and interface. You can hold user interviews and speak to them live on the phone or send out the questionnaire via email.
3. Customer Satisfaction
Resemblance to NPS, the task satisfaction metric allows users to give feedback on the usability of the product, whether they’ve successfully completed the task or not. Calculating your customer satisfaction( CSAT) score is a quick way to quantify the user experience. Simply ask users how satisfied they’re with the product and have them choose one of five options, ranging from very unsatisfied to very satisfied. Replies are normally assigned a value out of 100 and your average CSAT score is displayed as a percentage.
You can gather data for your CSAT score during user interviews or through online surveys. However, schedule a popup to appear after two or three successful tasks or interaction that asks “ How likely would you be to recommend us to a friend? ”
If you ’d preferably reach out to users while they ’re actively using the product. To get additional refined results, contemplate measuring CSAT at various junctions of the user experience to gain a wider understanding of how users feel while using the product. For example, first time users might answer differently when they first sign up or complete on-boarding than users who’ve been using the product for several months.
Conclusion
Measuring the success of your design involves putting into consideration the position of your client’s satisfaction and users happiness.
Follow me (@richtosho) for more free Business finance and marketing content
visit selar.co/m/Tosho for a one-on-one session with me for business and product development coaching.

