UX RESEARCH CASE STUDY | HYPER ISLAND

As I am diving into the world of UX design, it has forced me to stretch myself in new directions and to understand the different aspects of user research. Phew. It has been hard, especially to understand what and when to do things in order to come up with great insights.
I want to share with you my first case study, as a part of my UX fieldwork study at Hyper Island program. Hopefully, I will provide some useful insights to a fresh UX designer like myself that is currently exploring fieldwork and how to understand their users better. Let’s dive right into it!
THE BRIEF |

This was a challenging brief not only because of the broad topic but also because I am trying to help myself to understand my future role better (inception).
Who are the users?
To start off I wanted to define my target group and to create empathy with my users by understanding their life situations and needs. I created a series of assumptions about the users with the Kick off Canvas board. In this initial stage, I wanted to stay objective when searching for clues about my user needs. I also collected some information online on challenges Product Designers have.

With my target group defined with needs, I wanted to determine the most important needs to focus on in order to develop hypotheses. I used the Prioritization matrix that helped me understand what we knew about the needs already, and what we didn’t know, in order to see more clearly what I should prioritize.

Hypothesis |

I created two testable hypotheses based on my believes and assumptions that I found the most interesting to work with. These hypotheses laid the foundation for the upcoming user interviews and survey. I then started the process to validate my hypothesis and the first step for me was to create a online survey.
- Testable assumption! Good hypothesis is testable, you do not want to validate the hypothesis, you are trying to prove weather it is right or wrong.
Screening survey |
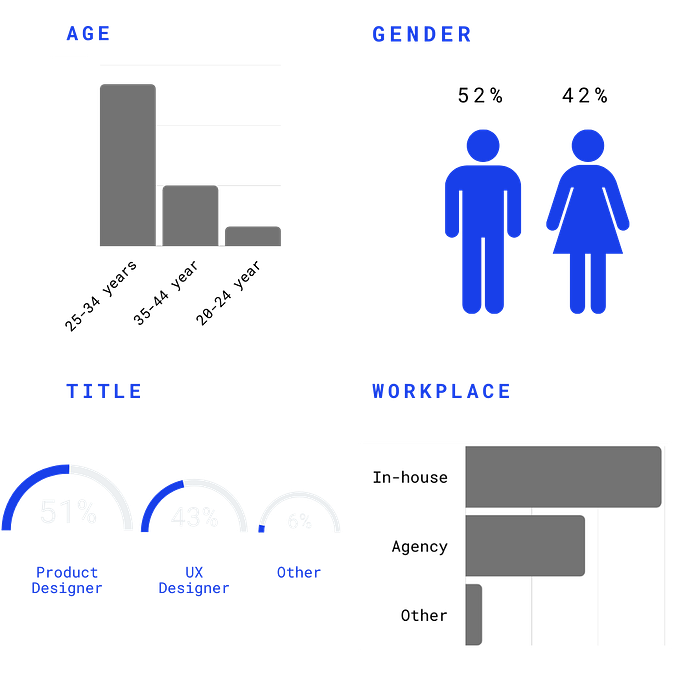
I designed a screening survey using Google Forms and recieved a total of 40 responses to my survey. I was looking to find people who live in Sweden between ages of 25–35. These charts below shows some results from my survey questions connected to my hypotheses.

- Make is simple! Quantitative questions should be measured easily, and are usually analyzed with the help of statistics. Such as charts, yes/no or multiselection. I went with two hypotheses in order to shorten down the survey to get more specific data.
Journey Map |
I used the journey map to braindump everything I know about my users needs and pains in a timeline. The journey map and the answers from my survey then became the foundation for my interview guide.
User Interviews |
Before conducting any of the interviews I created a interview guide with all my questions. I looked at my quantative data results and wanted to explore the result further through qualitative questions to understand WHY they answered in that specific way.
I selected 5 persons to interview based on the following criterias;
- 25–35 years
- Men and women
- Works in Sweden
- Completed the survey questions
Before starting the interviews I was striving for unbiased situations to get usable data from my users. I wanted a good structure for my guide and created a checkbox to make sure I covered the most important parts for these interviews. I used open-ended questions to understand the users needs and motivations, then I narrowed it down with additional questions in order to see patterns behind the answers.
- Important! It takes multiple skills like empathy, neutrality and persuasiveness when doing interviews. As for me, I need to develop the skills over time and learned to practice some important parts. The hardest part for me was to avoid leading questions — As humans we have our biases and on top of that our brains can create new biases instantly. The same can happen during the interview session.

Personas |
When getting the challenge we were not introduced to any persona so I wanted to create a reliable and realistic representation of my users. I created a moodboard based on both qualitative and quantitative data and included my assumptions aswell. Let me remind you, my challenge was to help Product Designers when they’re trying to understand their users, and therefore I created a broad scope persona.
- First question you should ask yourself is: what are these personas for? Only after you’ve answered this question, can you determine the appropriate scope for your personas. The smaller the scope, the richer data.

Synthesizing |
I transcribed all my interviews and in order to unify the data into ideas I started categorizing them using affinity mapping in Miro. It is a effective tool used to create groups and themes from user data. I then created labels for each group connected to my two hypotheses.

Looking at the results from the affinity mapping I was able to group four insight statements. I then formulated insights and guiding principles to help me frame “How Might We…” questions to create solution-centered ideas for our user’s needs and hypothesis.
- Connect the Dots! Observations are things you see and hear without judgement. Insights are a deeper understanding of what you see and hear, which guides you to your solution.

FINDINGS |
Hypothesis 1: We believe that As a Product Designer/UX designer it is hard to balance customer & business needs.
“Back it up with data or kill your darlings”
This hypothesis was proved. From my survey the majority of users said that their deliveries are mainly steered by client needs.
How to present data was a big part of the problem. They said that almost all stakeholders listens to data, but they found it hard to present it in a way that would convince them. From observing my users I noticed that it affected their overall confidence at work. The opportunity here is to collaborate closer to understand both the business and customer needs.
Recommendation: Create a workshop around presentation techniques in order to feel more confident to present ideas and to structure data/insights that is important for the business.
Hypothesis 2: We believe that Product Designers have different perceptions of UX work than their company has.
“UX colleagues have different perceptions of their tasks”
“ Some people just thinks that I draw”
This hypothesis was proved. However, my findings shows that Product Designers work differs a lot depending on their age, education, workplace, backgrounds etc. What stood out even more was that Product Designers has a hard time working with other Product Designers because they are working so differently.
The gains here are that everyone has different skills and could learn from eachother. But the pains were that it is hard to work in a group when everyone has different ways of working. One interesting part of it was that users feel that Product Designers have a hard time involving others in their work, such as developers, data analytics and editors.
From my survey 80% of my users said that they need to explain to others what their role entails at least once per month. This confirms that there’s a gap in the understanding of the role. The more my users talked, I understood that UX is a role that contains many different parts which sometimes makes it hard to understand both for themselves and others.
Additional insights was that:
- UX is a relatively new concept
- Different backgrounds and educations
- Ego and misunderstandings
- Lack of knowledge for the double diamond process
Recommendation: Empathy mapping journey in order to see our users needs at work. Further research is recommended aswell to understand the perspective of colleagues and employers.
CONCLUSION |
Findings from my qualitative and quantitative data confirmed and validated that my needs are important. However for my Hypothesis Two i realized that the core problem lies within the different ways of working between the Product Designers themselves. If Product Designers don’t understand their work, how could they tell others what they do?
This is a part of the UX Upskill course at Hyper Island. A big thanks to Martina Tranström the module leader for showing us the way! I welcome any constructive and positive feedback on this article :)

