
Definition, goal and uses
This behavioural journey is based on the behavioural science perspective used as a product design analysis.
The meaning of this framework is to identify possible barriers on the user journey and also to define behavioural metrics that we can use to validate or reject each barrier.
🙌 This framework is based on creating a journey map, tracking each decision and action from the user, adding some context, finding barriers that may affect those decisions and most important identifying what we need to measure to be able to validate those assumptions or hypotheses.
👩🏭 At what stage of the product can it be used? On an existing product or feature, as part of the research before the design phase or, to discover possible experiment opportunities.
🥳 What is the goal? Improve existing products, find possible problems/opportunities, and get users to perform a task naturally and painlessly.
The process
- Define the goal
- Map all the decisions, actions and behaviours that may or may not do the user.
- Find the physical and psychological barriers
- Add external context to the journey
- Find possible solutions and discover new opportunities
- Measure the barriers vs the interventions
Framework template in Miro
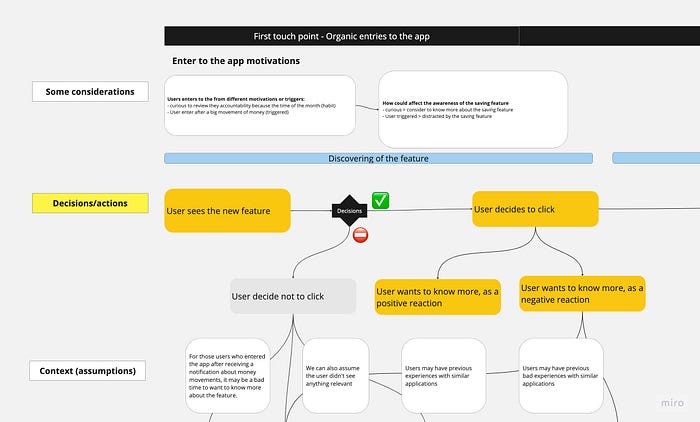
This is the base of the template for this framework, as we can see the structure is like a journey map where we can analyse each stage of the journey adding the behavioural analysis to it.

Defining the goal
Like all research methodologies, we need to start by defining a goal outcome, a target behaviour. By defining the goal, we will focus on the stages of the journey and the actions and decisions.
What could happen if we don’t define the goal? The journey could be inconsistent, never end or be too long as well as we could go down paths without exits or without importance.
An easy way to define properly a goal is by answering these questions:
- Who is acting? Describe the user
- At what moment? Describe the time of the day, month or year
- How many times? Describe the outcome you want to achieve
- What the user is going to obtain? Describe the value
Example
Imagine you are a product designer from a bank app and you want to experiment with a saving feature. This feature will allow the user to control their spending by setting spent limits, when there are close to reaching that limit the app will notify them.
The goal could be:
“At least 10% of the Super users (category of users) who enters the app to review their account (organic visits) during a week (time lapse) and see the feature (trigger) will set up their spending limit.”
Being very specific with the definition of the objective will also help us to define the metrics better and more accurately.
Mapping the decisions
With this goal in mind, we can start mapping all actions and decisions from the starting point of the journey, we will obtain a behavioural diagnosis.
Add and describe the context
Context may influence the user on the decision or action, so it's important to add it to our map.
When and where does the decision start? External triggers like push notifications, organic visits, and other things may the user see or hear before starting the action.
An example related to the saving feature (bank app)
- At the end of the month, users are more curious to review their bank account because is also the moment they receive their salary.
- Movements of large amounts of money are also triggered for users to enter the app and this can be at any time of the month.
Decisions and actions
We need to map each decision and action the user may or may not do, for all decisions made always exist the contrary actions, so remember to not only identify the “happy path” but also mention the “sad path”.
Questions we can ask ourselves to find the right journey.
- What is the desired path?
- What are the other possible paths?
- What are the opposite paths?
- What are the actions that the user can do?
- There are no wrong decisions nor is there the possibility of not deciding, leaving the journey is a decision too.
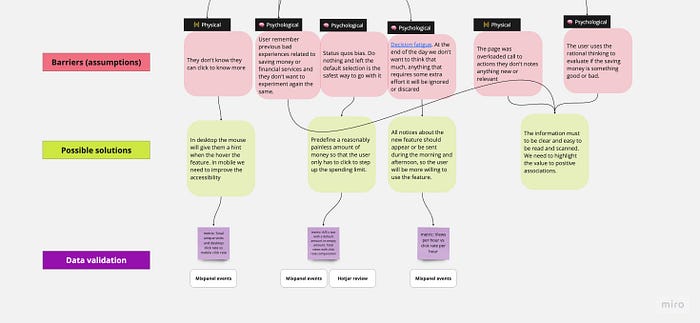
Finding the barriers
We need to differentiate the 🧠 psychological barriers from the 🚧physical barriers. Most of these barriers could be assumptions or previous knowledge we had, in any case, it is important to mention all of them so we can validate with data later.
🧠Psychological barriers are the ones that affect the rational or irrational decisions or actions of the user. Most of the cognitive biases could be categorised as psychological. Also, previous experiences, memories or rational connotations of the user are related to the psychological side.
🚧Physical barriers are related to the interface and the user experience, these ones could be easiest to identify than psychological ones. Accessibility issues and cognitive overload are the most common to find.
Is there any nudge affecting the decisions? Nudges could be barriers too.

Finding solutions
First of all, not all the barriers that we find are always going to have a solution, sometimes solving a barrier can be adding others or replacing it with another.
🚧Physical barrier solutions
Physical barriers are the easiest to solve because we can always improve the interface and the user experience. Many of these solutions are found in:
- Reviewing copies, making sure the coherence in the tone and voice, removing jargon and improving the UX writing on the main actions like CTAs
- Adding feedback, we can add o improve snack bars, notifications, or any other action that sometimes needs to show feedback to the user.
- Reviewing accessibility contrasts, we can use Figma or Sketch plugins to test the accessibility of the design.
🧠Psychological barrier solutions
These barriers can be difficult to find a solution easily. Here are some tips:
- Learn about how our thought systems 1 and 2 work, fast or slow thinking.
- Most cognitive biases can be modified or eliminated. I recommend reading…
- Adding or removing nudges, if you want to learn more about nudges you can access them here.

Measuring the barriers and the interventions
Ok, this is the fun part and the most important. Surely and very likely, all the barriers and solutions that we have found are assumptions or hypotheses, which is why we must validate or reject them with real data so we can do something about them. This is how we will learn how to obtain data related to user behaviour. Also, this is a perfect moment to identify where we can experiment or design an A/B test.
Keep in mind, each click is a behaviour, but so it is each decision not to click.
Example
If we want to validate or reject this assumption:
Decision fatigue. At the end of the day, we don’t want to think that much, anything that requires some extra effort will be ignored or discarded.
- Metric needed >> Numbers of views per hour vs numbers of click rate per hour.
Be ethical
🧐 And remember, knowledge is power and creating dark patterns or unethical solutions is very easy, the challenge is not to fall for these solutions and take care and respect the value we give to users 🌈.
Reference links:
- Irrational labs behavioural diagnosis
- Thinking, fast and slow by Daniel Kahneman
- The decision lab and their magnificent cognitive biases library
- Define Project Goals and Outcomes First to Save Yourself a Headache by dscout
- Nudge: The Final Edition by Richard H. Thaler, Cass R. Sunstein

