All you need to know: Retention
Retention is one of the most thrown-around term/jargon in the world of product management and startups. You have probably heard Startups Brag that they 50% Month on Month Retentions.
But What does Retention mean?
How many users/customers come back to your product or service over a specific period. Let's say you built this really dope to-do list app and your user love the app so much that they come back every day to track their task on your app, and you have retained users.
There are two ways to analyze Retention.
- Overall Retention: This is the number of users who came back to your product/service
- Month over Month / Week over Week: This is the number of users coming back every week or every month
Why is Retention Critical for Growth today?
- Apps Listed: There are over 5 Million Apps listed in the app store and play store; if you are not retaining your users, someone else will
- User Data: The amount of user data captured per user is massive. You can easily find patterns in the behaviors of users.
- Buyers Market: There are more products than the user is required to consume. You are not only competing online but also have offline competition.
80 % of users don’t use an app 3 days after installing it . This stat alone tells us how important it is to reatain your customer /user
Steps in Solving for User Retention
- Understand and Measure what your users are doing on your platform
- Identify why they're leave
- Don't Let them Leave
Sound simple, doesn't it, but how do we even start to measure Retention
3 Ways to Measure Retention
- N Day Retention
- Post-N Day Retention aka Unbounded Retention
- Bracket Retention aka Time-Bound Retention
N Day Retention
Consumers using your product or service exactly after N days after the first use
If you have a store and on the first day, say on January 1st, 100 customers
and on January 31st, 60 customers come then,
D30 Retention is 60%
Mainly used for Products that have predictable lifecycle (daily/weekly use case )
Unbounded Retention
Consumers coming and using your product after N days
It is always a great idea to look at Retention after 30,60 and 90 to understand how your users are behaving
If you have 100 customers on D1( Day 1 ) and 80 customers after D30, then post D30 Retention is 80%
Bracket Retention
Customers coming and using your product/service between N and N+x Days.
If you have 100 customers on D1( Day 1 ) and 14 customers came between D15 and D30, then D15-30 Retention is 40%
What Metrics Matter in Retention
Defining Key Metrics
- Ideal State/ Action: What is the one most important thing you want your users to do every time they use your product
- Business Goal: What is the goal of the business at this point in time? Do you measure it for each user?
- User Behavior: How Predictable or different are user cohorts and their behavior? Do they vary(and how) for each of your products?
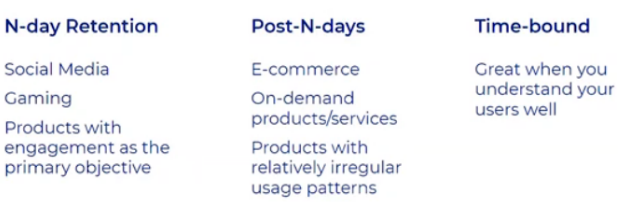
Example Key Metric based on Product Type
Building a Retention Strategy
3 Key Stages
- New Users: First-time users/buyers
- Active Users: Month on Month users/consumers
- Revived Users: Once active users who’d become inactive but have been activated again
Based on the 3 stages above retention is often depicted in 2 ways
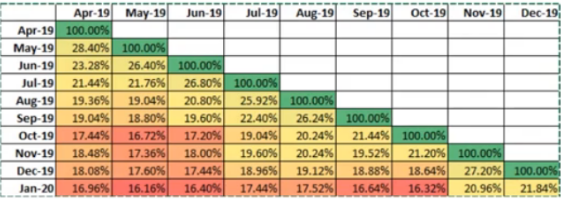
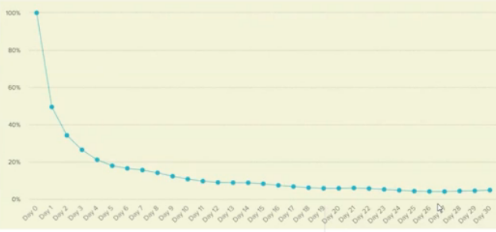
What do the above graphs tell us :
- Overall Retention /Settled Retention
- Product Market Fit or Not?
- Critical Time Periods
- Seasonal Trends
But these insights are not very actionable, to understand users better we use the RFM Analysis
RFM Analysis
RFM Analysis ranks and groups customers based on the recency, frequency, and monetary total of their recent transactions to identify the best customers
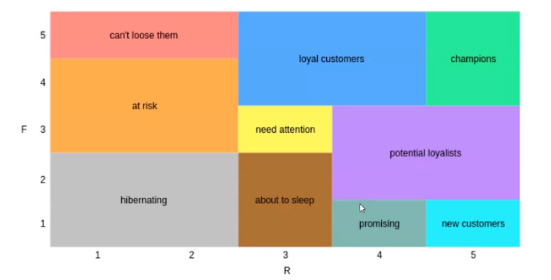
User-Defined Segments
Let's take examples of 2 functional customers of a coffee store
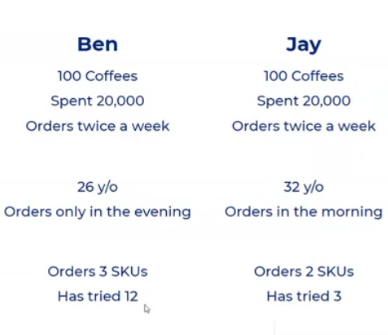
Segmentation Parameters :

Strategy to Plan
You’ll need to Convert:
- New Users to Active Users: Get new users to use your product, form a habit, and become an active user
- Active User to Power User: Increase the depth for active users to make them power users
Main Ingredients of the plan :
- Successful Onboarding: Ensuring that users experience the product the way it is intended — the first time
- Value Discovery: Ensuring user experiences /discovers the value of the product in the most optimal time
- Value Growth: Ensure the user gets incremental value for each additional time he repeats
Steps to Build a Plan
- Create an ideal user cohort and a churned user cohort: Both cohorts are part of the user cohort in the same period
- Identify drivers/behaviors to retention: Look for attributes and behaviors present in retained users but not in churned users
- Build and test hypotheses: Create hypotheses bases on action seen in step 2. Push campaigns/changes for action to a test cohort
Connect with me on

